

Translating the A1C assay into estimated average glucose values
- PMID: 18540046
- PMCID: PMC2742903
- DOI: 10.2337/dc08-0545
Translating the A1C assay into estimated average glucose values
Erratum in
- Diabetes Care. 2009 Jan;32(1):207
Abstract
Objective: The A1C assay, expressed as the percent of hemoglobin that is glycated, measures chronic glycemia and is widely used to judge the adequacy of diabetes treatment and adjust therapy. Day-to-day management is guided by self-monitoring of capillary glucose concentrations (milligrams per deciliter or millimoles per liter). We sought to define the mathematical relationship between A1C and average glucose (AG) levels and determine whether A1C could be expressed and reported as AG in the same units as used in self-monitoring.
Research design and methods: A total of 507 subjects, including 268 patients with type 1 diabetes, 159 with type 2 diabetes, and 80 nondiabetic subjects from 10 international centers, was included in the analyses. A1C levels obtained at the end of 3 months and measured in a central laboratory were compared with the AG levels during the previous 3 months. AG was calculated by combining weighted results from at least 2 days of continuous glucose monitoring performed four times, with seven-point daily self-monitoring of capillary (fingerstick) glucose performed at least 3 days per week.
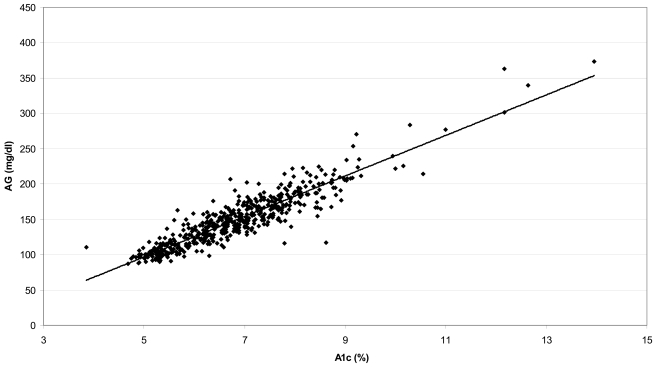
Results: Approximately 2,700 glucose values were obtained by each subject during 3 months. Linear regression analysis between the A1C and AG values provided the tightest correlations (AG(mg/dl) = 28.7 x A1C - 46.7, R(2) = 0.84, P < 0.0001), allowing calculation of an estimated average glucose (eAG) for A1C values. The linear regression equations did not differ significantly across subgroups based on age, sex, diabetes type, race/ethnicity, or smoking status.
Conclusions: A1C levels can be expressed as eAG for most patients with type 1 and type 2 diabetes.
Figures
Comment in
-
Translating the A1C Assay.Diabetes Care. 2008 Aug;31(8):1704-7. doi: 10.2337/dc08-0878. Epub 2008 Jun 7. Diabetes Care. 2008. PMID: 18540045 Free PMC article. No abstract available.
-
Translating the A1C assay into estimated average glucose values: response to Nathan et al.Diabetes Care. 2009 Jan;32(1):e10; author reply e12. doi: 10.2337/dc08-1214. Diabetes Care. 2009. PMID: 19114619 No abstract available.
-
Translating the A1C assay into estimated average glucose values: response to Nathan et al.Diabetes Care. 2009 Jan;32(1):e11; author reply e12. doi: 10.2337/dc08-1524. Diabetes Care. 2009. PMID: 19114620 No abstract available.
References
-
- Saudek CD, Derr RL, Kalvani RR: Assessing glycaemia in diabetes using self-monitoring blood glucose and hemoglobin A1c. JAMA 295:1688–1697, 2006 - PubMed
-
- American Diabetes Association: Standards of medical care of diabetes. Diabetes Care 30 (Suppl. 1):S4–S41, 2007 - PubMed
-
- Goldstein DE, Little R, Lorenz RA, Malone JI, Nathan DM, Peterson CM, Sacks DB: Tests of glycaemia in diabetes. Diabetes Care 27:1761–1773, 2004 - PubMed
-
- Diabetes Control and Complications Trial Research Group: The effect of intensive diabetes treatment on the development and progression of long-term complications in insulin-dependent diabetes mellitus: Diabetes Control and Complications Trial. N Engl J Med 329:978–986, 1993 - PubMed
-
- DCCT Research Group: The association between glycaemic exposure and long-term diabetic complications in the Diabetes Control and Complications Trial. Diabetes 44:968–983, 1995
Publication types
MeSH terms
Substances
LinkOut - more resources
Full Text Sources
Other Literature Sources
Medical
Molecular Biology Databases
