. 2008 Jun 17;105(24):8410-5.
doi: 10.1073/pnas.0802302105. Epub 2008 Jun 9.

Protein kinase C epsilon mediation of CRF- and ethanol-induced GABA release in central amygdala

Affiliations

Protein kinase C epsilon mediation of CRF- and ethanol-induced GABA release in central amygdala

Michal Bajo et al. Proc Natl Acad Sci U S A. .

Abstract

In the central amygdala (CeA), ethanol acts via corticotrophin-releasing factor (CRF) type 1 receptors to enhance GABA release. Amygdala CRF mediates anxiety associated with stress and drug dependence, and it regulates ethanol intake. Because mutant mice that lack PKCepsilon exhibit reduced anxiety-like behavior and alcohol consumption, we investigated whether PKCepsilon lies downstream of CRF(1) receptors in the CeA. Compared with PKCepsilon(+/+) CeA neurons, PKCepsilon(-/-) neurons showed increased GABAergic tone due to enhanced GABA release. CRF and ethanol stimulated GABA release in the PKCepsilon(+/+) CeA, but not in the PKCepsilon(-/-) CeA. A PKCepsilon-specific inhibitor blocked both CRF- and ethanol-induced GABA release in the PKCepsilon(+/+) CeA, confirming findings in the PKCepsilon(-/-) CeA. These results identify a PKCepsilon signaling pathway in the CeA that is activated by CRF(1) receptor stimulation, mediates GABA release at nerve terminals, and regulates anxiety and alcohol consumption.


Conflict of interest statement

The authors declare no conflict of interest.

Figures
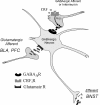
Fig. 1.
Fig. 1.
Simplified schematic of rodent CeA circuitry and hypothetical sites of ethanol and CRF action on GABAergic synapses. Most neurons in the CeA are GABAergic inhibitory projection or interneurons that contain CRF or other neuropeptides as cotransmitters. (Upper synapse) Ethanol may enhance the release of GABA (filled ellipsoids) from GABAergic afferents or interneurons either via the release from the same terminal as CRF (gray triangles), which then acts on CRF1 receptors on the terminal to elicit (black arrow) release of more GABA via a PKCε-mediated mechanism, or direct activation of CRF1 receptors to elicit the release of more GABA. Thus, CRF and ethanol both augment the inhibition of CeA projection interneurons (cocontaining CRF, opioids, or NPY), leading to excitation of downstream (e.g., BNST) neurons by disinhibition. Activation of presynaptic opioid, CB1, or NPY receptors (data not shown) may reduce GABA release onto CeA inhibitory projection neurons, increasing their excitability and release of GABA onto downstream targets such as the BNST. (Lower synapse) Glutamatergic afferents from basolateral amygdala (BLA) or prefrontal cortex (PFC) excite the CeA inhibitory neurons via release of glutamate (filled rectangles) and activation of glutamate receptors.
Fig. 2.
Fig. 2.
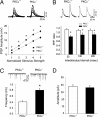
Basal GABAergic transmission is enhanced in CeA of PKCε−/− mice. (A) (Upper) Superimposed traces of five representative GABAA IPSPs evoked by five incrementally increasing stimulus intensities in slices from PKCε+/+ (Left) and PKCε−/− (Right) mice. (Lower) The mean baseline IPSP amplitudes were significantly increased (*, P < 0.05) in PKCε−/− CeA neurons (n = 31) compared with PKCε+/+ neurons (n = 28). (B) Baseline PPF of IPSPs is decreased in CeA from PKCε−/− mice. (Upper) Representative traces of a paired-pulse study (at 50-msec ISI) of IPSPs in CeA neurons from PKCε+/+ (Left) and PKCε−/− (Right) mice. (Lower) Baseline PPF of IPSPs was significantly (*, P < 0.001) reduced in CeA from PKCε−/− mice (n = 25) compared with PKCε+/+ mice (n = 26). (C) (Upper) Representative mIPSCs from PKCε+/+ (Left; n = 15) and PKCε−/− (Right; n = 9). (Lower) The mean frequency of mIPSCs was significantly (*, P < 0.001) greater in CeA neurons from PKCε−/− mice (n = 8) compared with those of PKCε+/+ mice (n = 8). (D) The same group of neurons showed no significant alteration of mean amplitude of mIPSCs in PKCε−/− mice. Statistical significance (*, P < 0.05) was calculated by two-tailed t tests.
Fig. 3.
Fig. 3.
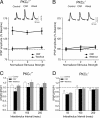
CRF increases GABAergic transmission in CeA neurons from PKCε+/+ mice, but not from PKCε−/− mice. (A) (Upper) Representative GABAA IPSPs in a CeA slice from a PKCε+/+ mouse recorded before, during, and after superfusion of 200 nM CRF. (Lower) CRF increased the mean IPSP amplitudes in PKCε+/+ CeA neurons (n = 12; *, P < 0.001) with recovery on washout (20 min). (B) CRF reduced the PPF ratio of IPSPs in PKCε+/+ neurons (n = 12; *, P < 0.05). (C) (Upper) IPSPs in a CeA slice from a PKCε−/− mouse. (Lower) CRF did not alter the mean IPSP amplitudes in PKCε−/− CeA neurons (n = 13). (D) CRF did not alter PPF ratios of IPSPs in CeA PKCε−/− neurons (n = 13). Statistical significance (#, P < 0.05) was calculated by repeated measures ANOVA and Newman–Keuls tests.
Fig. 4.
Fig. 4.
CRF increases GABAergic transmission in CeA through a presynaptic, PKCε-dependent mechanism. (A) (Upper) Representative mIPSCs from a PKCε+/+ CeA neuron. CRF increased (*, P < 0.05) the frequency but not the amplitude of the mIPSCs. (Lower) Cumulative frequency histogram from the same PKCε+/+ neuron indicating shorter interevent intervals (higher frequency) during application of CRF. (B) (Upper) Representative mIPSCs from a PKCε−/− CeA neuron. CRF significantly (*, P < 0.05) decreased the frequency of the mIPSCs. (Lower) Cumulative frequency histogram from the PKCε−/− mouse neuron, indicating longer interevent intervals (lower frequency) during the application of CRF. (C and D) Cumulative amplitude histogram from the PKCε+/+ (C) and the PKCε−/− CeA neuron (D), showing no ethanol-induced alteration in the distribution of mIPSC amplitudes. (E) CRF increased the mean frequency (expressed as percentage of control) of mIPSCs in PKCε+/+ CeA neurons (n = 5), but decreased it in PKCε−/− neurons (n = 3), with recovery on washout (data not shown). **, P < 0.0001 and *, P < 0.005 compared with a baseline mean frequency of 100% (dashed line) by one sample t tests. (F) CRF did not alter the mean mIPSC amplitudes in either genotype.
Fig. 5.
Fig. 5.
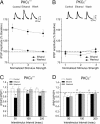
Ethanol increases GABAergic transmission in CeA neurons from PKCε+/+ mice, but not from PKCε−/− mice. (A) (Upper) Representative IPSPs in a PKCε+/+ CeA neuron before, during, and after superfusion of 44 mM ethanol. (Lower) Ethanol significantly increased (*, P < 0.001) the mean IPSPs in PKCε+/+ CeA neurons (n = 19). (B) Ethanol-reduced PPF ratios of IPSPs (*, P < 0.001) with recovery on washout in PKCε+/+ CeA neurons. (C) (Upper) IPSPs in a CeA neuron from a PKCε−/− mouse. (Lower) Ethanol did not alter the mean IPSP amplitudes in 15 CeA neurons from PKCε−/− mice. (D) Ethanol did not alter the ratios at any of the ISIs tested in PKCε−/− CeA neurons. Statistical significance (#, P < 0.05) was calculated by repeated measures ANOVA and post hoc Newman–Keuls tests.
Fig. 6.
Fig. 6.
Ethanol, like CRF (see Fig. 4), increases GABAergic transmission in the CeA of PKCε+/+, but not in PKCε−/− mice. (A) (Upper) mIPSCs from a PKCε+/+ CeA neuron. Ethanol increased the frequency but not the amplitude of the mIPSCs. (Lower) Cumulative frequency histogram from the same PKCε+/+ neuron, indicating shorter interevent intervals (higher frequency) during ethanol superfusion. (B) (Upper) mIPSCs from a PKCε−/− CeA neuron. Ethanol significantly decreased the frequency of the mIPSCs. (Lower) Cumulative frequency histogram from this PKCε−/− neuron, indicating longer interevent intervals (lower frequency) during ethanol application. (C and D) Cumulative amplitude histogram from the PKCε+/+ (C) and the PKCε−/− CeA neuron (D), showing no ethanol-induced alteration in the distribution of mIPSC amplitudes. (E) Ethanol significantly increased the mean frequency of mIPSCs in 6 PKCε+/+ CeA neurons but decreased it in 6 CeA PKCε−/− neurons, with recovery on washout (data not shown). **, P < 0.0001 and *, P < 0.005 compared with a baseline mean frequency of 100% (dashed line) by one sample t tests. (F) Ethanol did not alter the mean mIPSC amplitudes in either genotype.

References

    1. Koob GF, Heinrichs SC. A role for corticotropin releasing factor and urocortin in behavioral responses to stressors. Brain Res. 1999;848:141–152. - PubMed
    1. Reul JM, Holsboer F. Corticotropin-releasing factor receptors 1 and 2 in anxiety and depression. Curr Opin Pharmacol. 2002;2:23–33. - PubMed
    1. Campbell BM, Morrison JL, Walker EL, Merchant KM. Differential regulation of behavioral, genomic, and neuroendocrine responses by CRF infusions in rats. Pharmacol Biochem Behav. 2004;77:447–455. - PubMed
    1. Nishikawa H, Hata T, Itoh E, Funakami Y. A role for corticotropin-releasing factor in repeated cold stress-induced anxiety-like behavior during forced swimming and elevated plus-maze tests in mice. Biol Pharm Bull. 2004;27:352–356. - PubMed
    1. Smith GW, et al. Corticotropin releasing factor receptor 1-deficient mice display decreased anxiety, impaired stress response, and aberrant neuroendocrine development. Neuron. 1998;20:1093–1102. - PubMed

Publication types

MeSH terms