

Molecular imaging of lymphoid organs and immune activation by positron emission tomography with a new [18F]-labeled 2'-deoxycytidine analog
- PMID: 18542051
- PMCID: PMC2720060
- DOI: 10.1038/nm1724
Molecular imaging of lymphoid organs and immune activation by positron emission tomography with a new [18F]-labeled 2'-deoxycytidine analog
Abstract
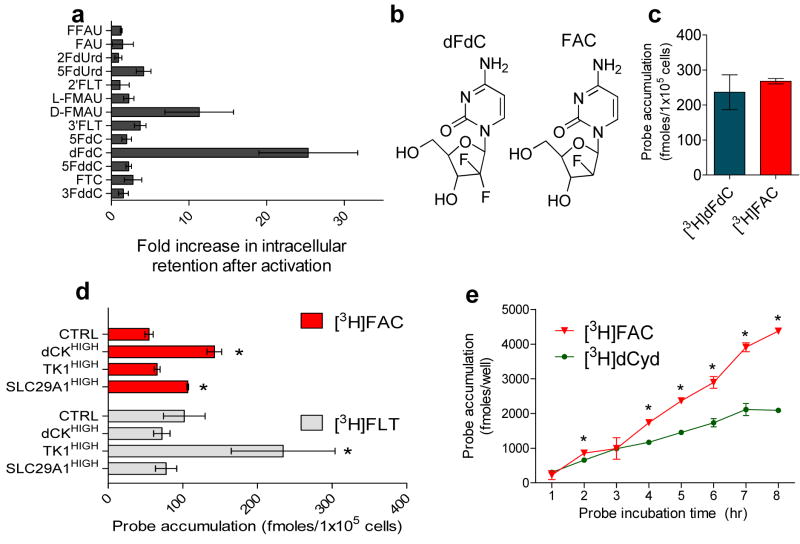
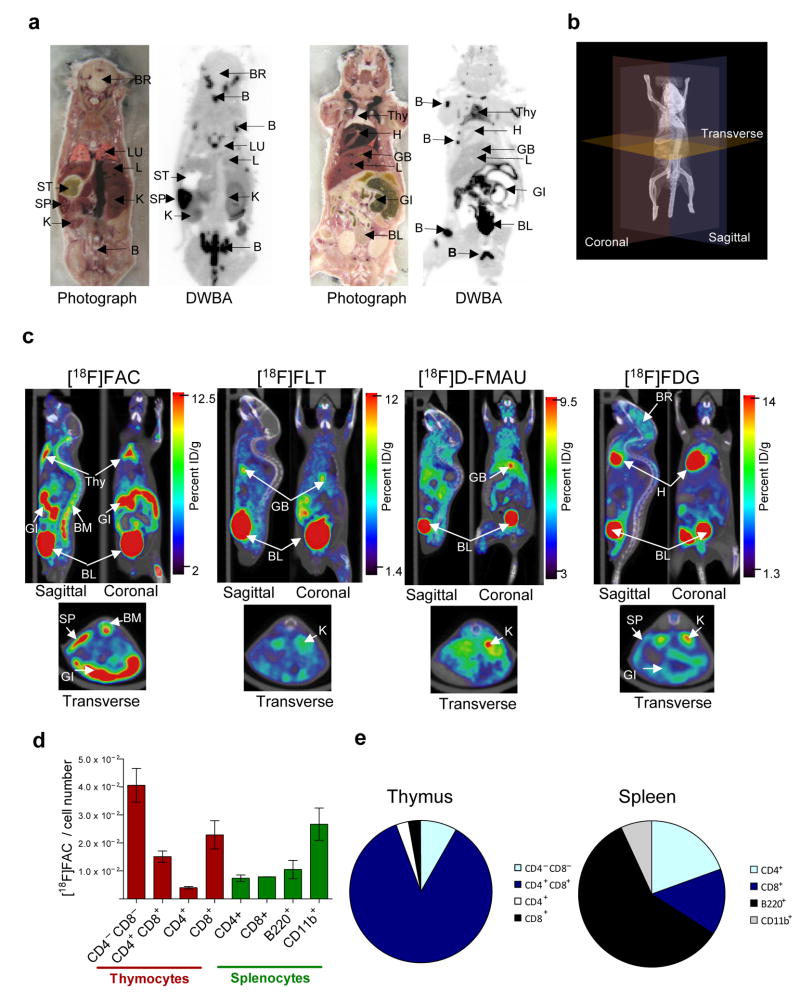
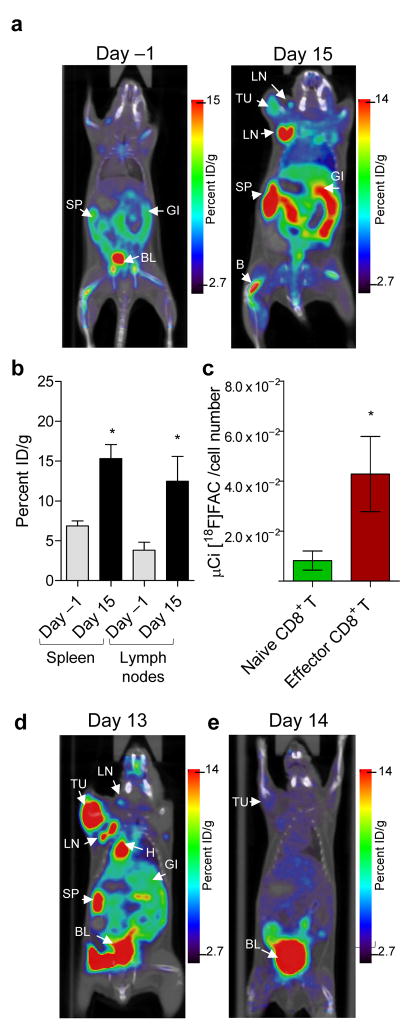
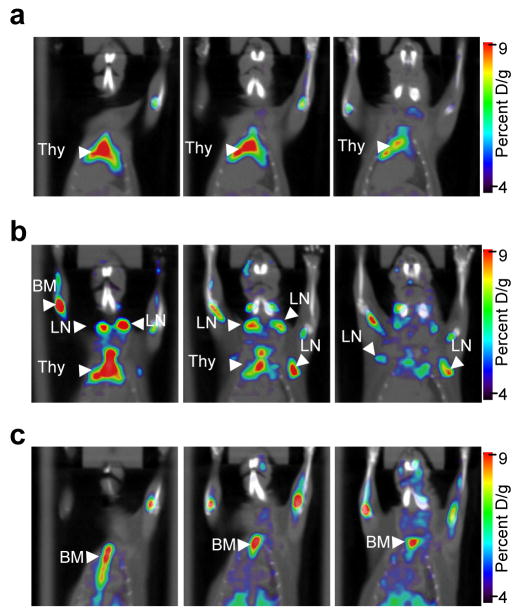
Monitoring immune function with molecular imaging could have a considerable impact on the diagnosis and treatment evaluation of immunological disorders and therapeutic immune responses. Positron emission tomography (PET) is a molecular imaging modality with applications in cancer and other diseases. PET studies of immune function have been limited by a lack of specialized probes. We identified [(18)F]FAC (1-(2'-deoxy-2'-[(18)F]fluoroarabinofuranosyl) cytosine) by differential screening as a new PET probe for the deoxyribonucleotide salvage pathway. [(18)F]FAC enabled visualization of lymphoid organs and was sensitive to localized immune activation in a mouse model of antitumor immunity. [(18)F]FAC microPET also detected early changes in lymphoid mass in systemic autoimmunity and allowed evaluation of immunosuppressive therapy. These data support the use of [(18)F]FAC PET for immune monitoring and suggest a wide range of clinical applications in immune disorders and in certain types of cancer.
Figures
Similar articles
-
Stratification of nucleoside analog chemotherapy using 1-(2'-deoxy-2'-18F-fluoro-β-D-arabinofuranosyl)cytosine and 1-(2'-deoxy-2'-18F-fluoro-β-L-arabinofuranosyl)-5-methylcytosine PET.J Nucl Med. 2012 Feb;53(2):275-80. doi: 10.2967/jnumed.111.090407. J Nucl Med. 2012. PMID: 22302964 Free PMC article.
-
PET probes for distinct metabolic pathways have different cell specificities during immune responses in mice.J Clin Invest. 2010 Jun;120(6):2005-15. doi: 10.1172/JCI41250. Epub 2010 May 17. J Clin Invest. 2010. PMID: 20484820 Free PMC article.
-
Novel PET probes specific for deoxycytidine kinase.J Nucl Med. 2010 Jul;51(7):1092-8. doi: 10.2967/jnumed.109.073361. Epub 2010 Jun 16. J Nucl Med. 2010. PMID: 20554721 Free PMC article.
-
1-(2'-Deoxy-2'-[18F]fluoroarabinofuranosyl)cytosine.2010 Dec 18 [updated 2011 Mar 9]. In: Molecular Imaging and Contrast Agent Database (MICAD) [Internet]. Bethesda (MD): National Center for Biotechnology Information (US); 2004–2013. 2010 Dec 18 [updated 2011 Mar 9]. In: Molecular Imaging and Contrast Agent Database (MICAD) [Internet]. Bethesda (MD): National Center for Biotechnology Information (US); 2004–2013. PMID: 21413197 Free Books & Documents. Review.
-
(18)F-labeled positron emission tomographic radiopharmaceuticals in oncology: an overview of radiochemistry and mechanisms of tumor localization.Semin Nucl Med. 2007 Nov;37(6):400-19. doi: 10.1053/j.semnuclmed.2007.08.004. Semin Nucl Med. 2007. PMID: 17920348 Review.
Cited by
-
The Positron Emission Tomography Tracer 3'-Deoxy-3'-[18F]Fluorothymidine ([18F]FLT) Is Not Suitable to Detect Tissue Proliferation Induced by Systemic Yersinia enterocolitica Infection in Mice.PLoS One. 2016 Oct 4;11(10):e0164163. doi: 10.1371/journal.pone.0164163. eCollection 2016. PLoS One. 2016. PMID: 27701464 Free PMC article.
-
Molecular imaging for cancer immunotherapy.Immunooncol Technol. 2020 Mar 27;5:10-21. doi: 10.1016/j.iotech.2020.03.001. eCollection 2020 Mar. Immunooncol Technol. 2020. PMID: 35756142 Free PMC article. Review.
-
A systematic approach to biomarker discovery; preamble to "the iSBTc-FDA taskforce on immunotherapy biomarkers".J Transl Med. 2008 Dec 23;6:81. doi: 10.1186/1479-5876-6-81. J Transl Med. 2008. PMID: 19105846 Free PMC article.
-
Cell Tracking in Cancer Immunotherapy.Front Med (Lausanne). 2020 Feb 14;7:34. doi: 10.3389/fmed.2020.00034. eCollection 2020. Front Med (Lausanne). 2020. PMID: 32118018 Free PMC article. Review.
-
18F-FAC PET Selectively Images Liver-Infiltrating CD4 and CD8 T Cells in a Mouse Model of Autoimmune Hepatitis.J Nucl Med. 2018 Oct;59(10):1616-1623. doi: 10.2967/jnumed.118.210328. Epub 2018 Apr 26. J Nucl Med. 2018. PMID: 29700125 Free PMC article.
References
-
- Koehne G, et al. Serial in vivo imaging of the targeted migration of human HSV-TK-transduced antigen-specific lymphocytes. Nature biotechnology. 2003;21:405–413. - PubMed
-
- Su H, Forbes A, Gambhir SS, Braun J. Quantitation of cell number by a positron emission tomography reporter gene strategy. Mol Imaging Biol. 2004;6:139–48. - PubMed
Publication types
MeSH terms
Substances
Grants and funding
LinkOut - more resources
Full Text Sources
Other Literature Sources
Medical
Molecular Biology Databases
