

doi: 10.1364/oe.16.005782.
Microfluidic CARS cytometry
Affiliations
- PMID: 18542688
- PMCID: PMC2684790
- DOI: 10.1364/oe.16.005782
Item in Clipboard
Microfluidic CARS cytometry
Opt Express.
.
Abstract
Coherent anti-stokes Raman scattering (CARS) flow cytometry was demonstrated by combining a laser-scanning CARS microscope with a polydimethylsiloxane (PDMS) based microfluidic device. Line-scanning across the hydrodynamically focused core stream was performed for detection of flowing objects. Parameters were optimized by utilizing polystyrene beads as flowing particles. Population measurements of adipocytes isolated from mouse fat tissues demonstrated the viability of microfluidic CARS cytometry for quantitation of adipocyte size distribution. CARS cytometry could be a new modality for quantitative analysis with vibrational selectivity.
Figures
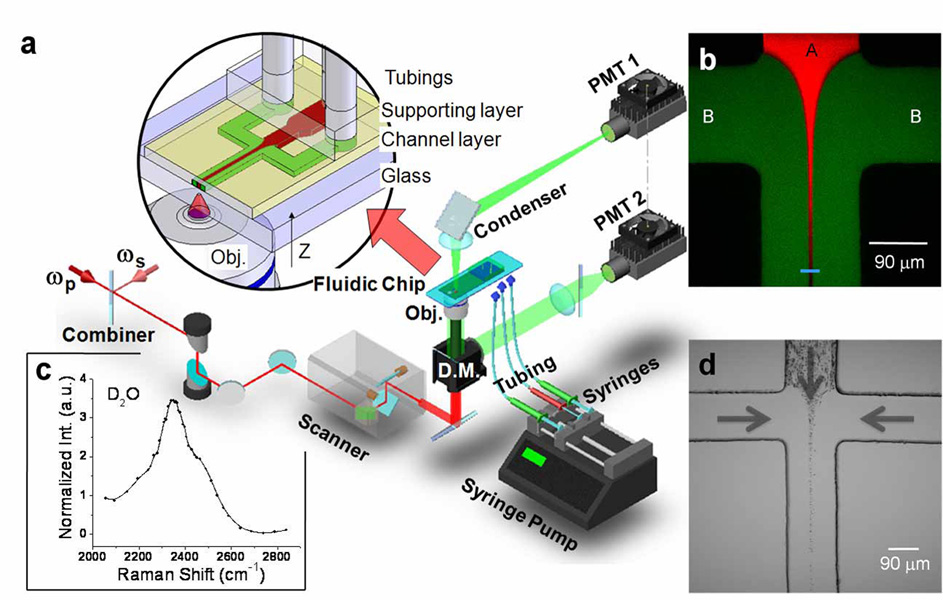
Schematic diagram of CARS cytometry and imaging illustration of the hydrodynamic focusing effect. (a) Schematic of microfluidic CARS cytometry. The blowup inset shows layers of microfluidic chip providing function of hydrodynamic focusing for cytometry analysis. The schematic drawings are not to scale. D.M=dichroic mirror; Obj=objective. (b) Hydrodynamic focusing effect examined by forward CARS imaging of D2O injected as the core flow (red) from inlet A, and backward TPEF imaging of fluorescent microspheres in the sheath flow (green) injected from inlet B. The bar over the core flow indicates the line-scan window. (c) CARS spectrum of D2O measured by tuning the frequency of the slave laser from 11300 to 12085 cm−1. The peak is located around 2350 cm−1. (d) Transmission image showing 2 µm beads in the core around the flow impinging area in a microfluidic chip. Arrows show the flow directions.

Variations of bead size and signal intensity correlated to S/F ratio. (a) S/F ratio versus mean size of 10 µm PS beads. As increasing the S/F ratio, size variation was reduced and the mean size was closer to the true value. (b) S/F ratio versus mean size of 2 µm PS beads. The size variation mainly resulted from the unmatched channel depth. The insets tagged A, B, and C in (a) and (b) are the time-stack CARS images (~160 ms) relative to the S/F ratio shown in the plots. Time-stack CARS images were obtained by signaling along the fixed 1-D scan window of ~34 µm. Arrows besides inset C indicate the direction of time flow. (c) S/F ratio versus mean signal intensity of 10 µm PS beads. (d) Signal history of 10 µm PS beads within 1 ms. The signal trace was obtained by setting the S/F ratio to be 0.203. All CARS signals were backward detected.

Population distribution of size mixed PS beads verified by microfluidic CARS cytometry. (a) A typical time-stack CARS image (~600 ms) obtained by signaling along the 1-D scan window of ~34 µm for population analysis. The arrow indicates the direction of time flow. (b) Bead counts versus size of a solution mixed with 5 µm and 10 µm beads. The S/F ratio was set ~0.2.

Size population of adipocytes verified by microfluidic CARS cytometry. (a) Size distribution of isolated adipocytes retrieved from time stack images of CARS cytometry. The S/F ratio was set ~0.2. (b) Size distribution of isolated adipocytes obtained by analyzing 8 CARS images for microscopic-based cytometry. Size analyses were obtained by using a program developed on MATLAB platform. The inset in (b) shows a backward-detected CARS image of purified adipocytes from mouse fat tissues. Bar= 30 µm.
References
-
- Shapiro HM. Practical Flow Cytometry. 4th ed. New York: Wiley Liss; 2003.
-
- Jennings CD, Foon KA. Recent Advances in Flow Cytometry: Application to the Diagnosis of Hematologic Malignancy. Blood. 1997;90:2863–2892. - PubMed
-
- Chung TD, Kim HC. Recent advances in miniaturized microfluidic flow cytometry for clinical use. Electrophoresis. 2007;28:4511–4520. - PubMed
-
- Gordon A, Colman-Lerner A, Chin TE, Benjamin KR, Yu RC, Brent R. Single-cell quantification of molecules and rates using open-source microscope-based cytometry. Nat. Methods. 2007;4:175–181. - PubMed
-
- Perfetto SP, Chattopadhyay PK, Roederer M. Seventeen-colour flow cytometry: unravelling the immune system. Nat. Rev. Immun. 2004;4:648–655. - PubMed
Publication types
MeSH terms
Grants and funding
LinkOut - more resources
Full Text Sources
Other Literature Sources
