

Treatment with proteasome inhibitor bortezomib enhances antigen-specific CD8+ T-cell-mediated antitumor immunity induced by DNA vaccination
- PMID: 18542898
- PMCID: PMC2535907
- DOI: 10.1007/s00109-008-0370-y
Treatment with proteasome inhibitor bortezomib enhances antigen-specific CD8+ T-cell-mediated antitumor immunity induced by DNA vaccination
Abstract
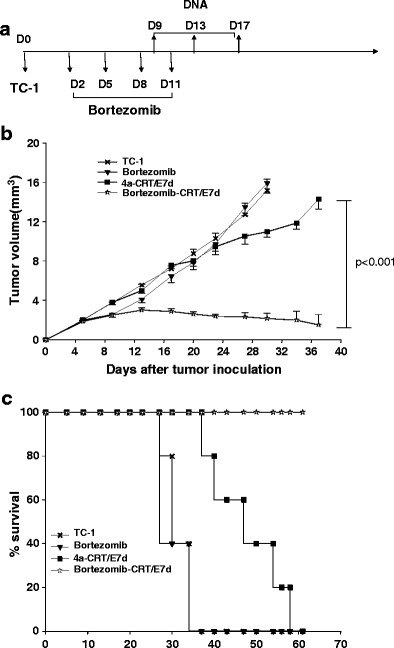
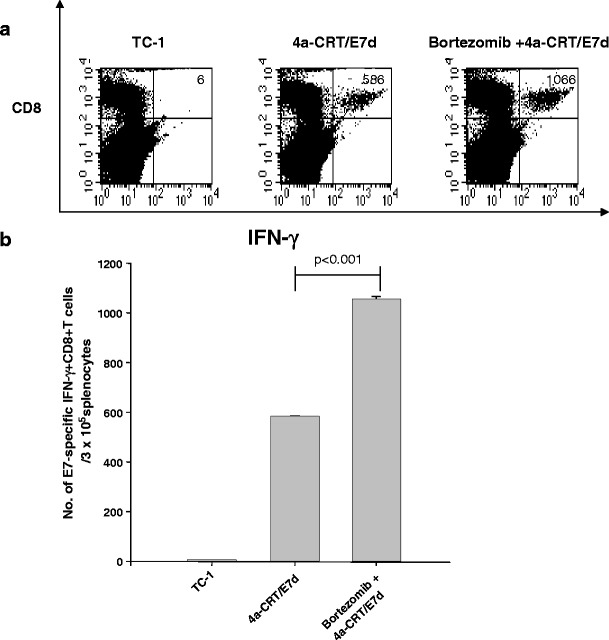
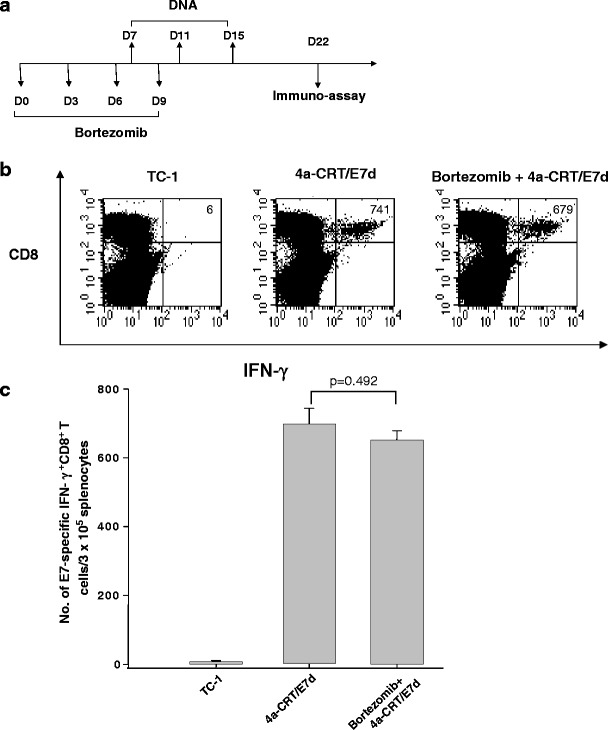
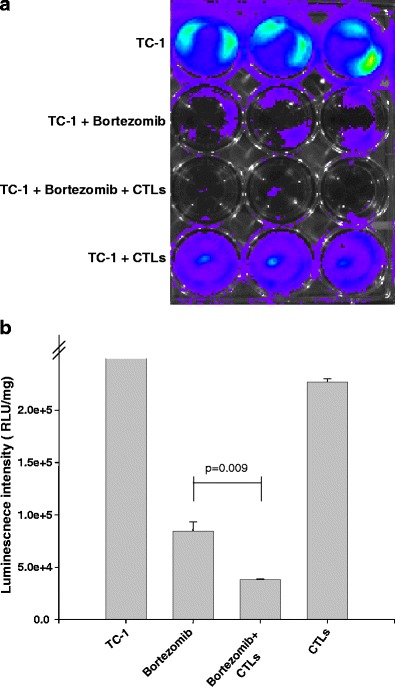
There is an urgent need to develop new innovative therapies for the control of cancer. Antigen-specific immunotherapy and the employment of proteasome inhibitors have emerged as two potentially plausible approaches for the control of cancer. In the current study, we explored the combination of the DNA vaccine encoding calreticulin (CRT) linked to human papillomavirus type 16 E7 antigen (CRT/E7) with the proteasome inhibitor, bortezomib, for their ability to generate E7-specific immune responses and antitumor effects in vaccinated mice. We found that the combination of treatment with bortezomib and CRT/E7(detox) DNA generated more potent E7-specific CD8+ T cell immune responses and better therapeutic effects against TC-1 tumors in tumor-bearing mice compared to monotherapy. Furthermore, we found that treatment with bortezomib led to increased apoptosis of TC-1 tumor cells and could render the TC-1 tumor cells more susceptible to lysis by E7-specific CD8+ T cells. Our data have significant implications for future clinical translation.
Figures

Comment in
-
Productively combining proteasome inhibition with the immunotherapy of cancer.J Mol Med (Berl). 2008 Aug;86(8):857-60. doi: 10.1007/s00109-008-0384-5. J Mol Med (Berl). 2008. PMID: 18612622 Free PMC article. No abstract available.
Similar articles
-
Bortezomib enhances antigen-specific cytotoxic T cell responses against immune-resistant cancer cells generated by STAT3-ablated dendritic cells.Pharmacol Res. 2013 May;71:23-33. doi: 10.1016/j.phrs.2013.02.001. Epub 2013 Feb 18. Pharmacol Res. 2013. PMID: 23428347 Free PMC article.
-
Pretreatment with cisplatin enhances E7-specific CD8+ T-Cell-mediated antitumor immunity induced by DNA vaccination.Clin Cancer Res. 2008 May 15;14(10):3185-92. doi: 10.1158/1078-0432.CCR-08-0037. Clin Cancer Res. 2008. PMID: 18483387 Free PMC article.
-
Low-dose radiation enhances therapeutic HPV DNA vaccination in tumor-bearing hosts.Cancer Immunol Immunother. 2009 May;58(5):737-48. doi: 10.1007/s00262-008-0596-0. Epub 2008 Sep 25. Cancer Immunol Immunother. 2009. PMID: 18815785 Free PMC article.
-
[Proteasome inhibitor].Nihon Rinsho. 2010 Jun;68(6):1079-84. Nihon Rinsho. 2010. PMID: 20535959 Review. Japanese.
-
Bortezomib as the first proteasome inhibitor anticancer drug: current status and future perspectives.Curr Cancer Drug Targets. 2011 Mar;11(3):239-53. doi: 10.2174/156800911794519752. Curr Cancer Drug Targets. 2011. PMID: 21247388 Free PMC article. Review.
Cited by
-
Combining immunotherapy and targeted therapies in cancer treatment.Nat Rev Cancer. 2012 Mar 22;12(4):237-51. doi: 10.1038/nrc3237. Nat Rev Cancer. 2012. PMID: 22437869 Free PMC article. Review.
-
Bortezomib enhances antigen-specific cytotoxic T cell responses against immune-resistant cancer cells generated by STAT3-ablated dendritic cells.Pharmacol Res. 2013 May;71:23-33. doi: 10.1016/j.phrs.2013.02.001. Epub 2013 Feb 18. Pharmacol Res. 2013. PMID: 23428347 Free PMC article.
-
Productively combining proteasome inhibition with the immunotherapy of cancer.J Mol Med (Berl). 2008 Aug;86(8):857-60. doi: 10.1007/s00109-008-0384-5. J Mol Med (Berl). 2008. PMID: 18612622 Free PMC article. No abstract available.
-
Strategies for enhancing vaccine-induced CTL antitumor immune responses.J Biomed Biotechnol. 2012;2012:605045. doi: 10.1155/2012/605045. Epub 2012 Oct 2. J Biomed Biotechnol. 2012. PMID: 23093850 Free PMC article. Review.
-
Potential usage of proteasome inhibitor bortezomib (Velcade, PS-341) in the treatment of metastatic melanoma: basic and clinical aspects.Am J Cancer Res. 2011;1(7):913-24. Epub 2011 Aug 23. Am J Cancer Res. 2011. PMID: 22016836 Free PMC article.
References
-
- Hung CF, Wu TC. Improving DNA vaccine potency via modification of professional antigen presenting cells. Curr Opin Mol Ther. 2003;5:20–24. - PubMed
Publication types
MeSH terms
Substances
Grants and funding
LinkOut - more resources
Full Text Sources
Research Materials
