. 2008 Sep;74(3):614-27.
doi: 10.1124/mol.108.048520. Epub 2008 Jun 10.

Mutations of the GABA-A receptor alpha1 subunit M1 domain reveal unexpected complexity for modulation by neuroactive steroids

Affiliations

Mutations of the GABA-A receptor alpha1 subunit M1 domain reveal unexpected complexity for modulation by neuroactive steroids

Gustav Akk et al. Mol Pharmacol. 2008 Sep.

Abstract

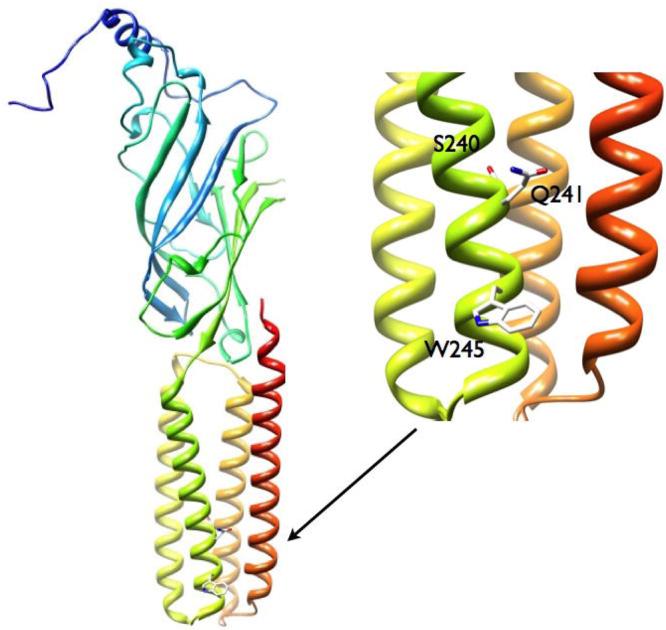
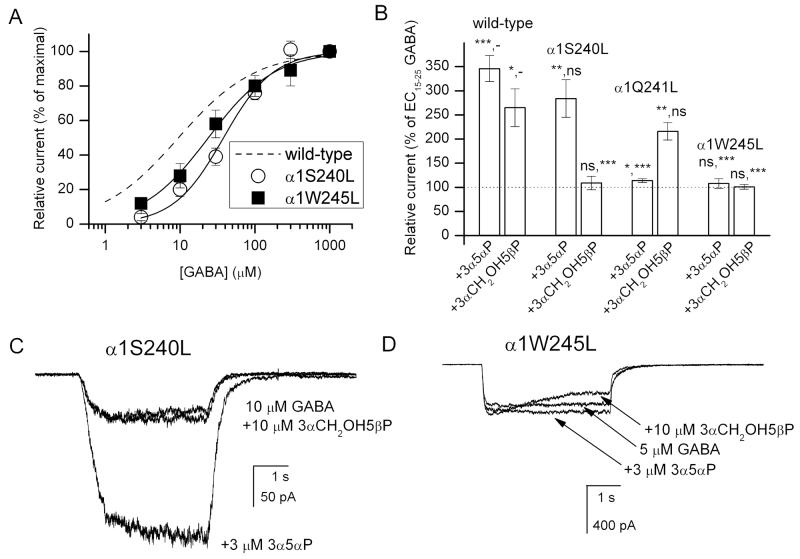
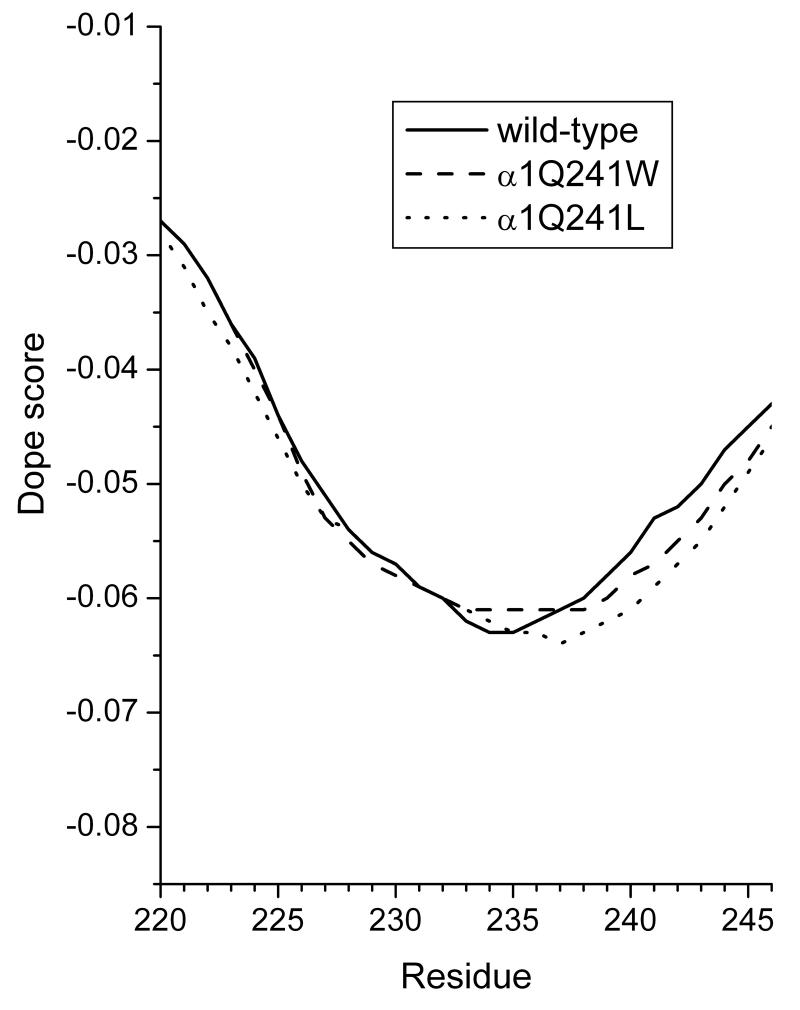
Neuroactive steroids are among the most efficacious modulators of the mammalian GABA-A receptor. Previous work has proposed that receptor potentiation is mediated by steroid interactions with a site defined by the residues alpha1Asn407/Tyr410 in the M4 transmembrane domain and residue alpha1Gln241 in the M1 domain. We examined the role of residues in the alpha1 subunit M1 domain in the modulation of the rat alpha1beta2gamma2L GABA-A receptor by neuroactive steroids. The data demonstrate that the region is critical to the actions of potentiating neuroactive steroids. Receptors containing the alpha1Q241W or alpha1Q241L mutations were insensitive to (3alpha,5alpha)-3-hydroxypregnan-20-one (3alpha5alphaP), albeit with different underlying mechanisms. The alpha1Q241S mutant was potentiated by 3alpha5alphaP, but the kinetic mode of potentiation was altered by the mutation. It is noteworthy that the alpha1Q241L mutation had no effect on channel potentiation by (3alpha,5alpha)-3-hydroxymethyl-pregnan-20-one, but mutation of the neighboring residue, alpha1Ser240, prevented channel modulation. A steroid lacking an H-bonding group on C3 (5alpha-pregnan-20-one) potentiated the wild-type receptor but not the alpha1Q241L mutant. The findings are consistent with a model in which the alpha1Ser240 and alpha1Gln241 residues shape the surface to which steroid molecules bind.


Figures

Figure 1
Figure 1
Structural model of the rat α1 subunit, the expanded view shows the locations of the M1 residues studied in this work (M1 is in green and M4 is in red).
Figure 2
Figure 2. Activation and modulation of the wild-type and α1Q241W, α1Q241L and α1Q241S mutant receptors
(A) Wild-type and mutant receptors were activated by GABA, and the mean fractional peak responses (± SEM) from 5-15 cells are plotted as a function of GABA concentration. Curve fitting to the Hill equation yields the following parameters. Wild-type: EC50 = 9.4 ± 1.1 μM, nH = 0.9 ± 0.1; α1Q241W: EC50 = 2.5 ± 0.2 μM, nH = 1.0 ± 0.1; α1Q241L: EC50 = 43.6 ± 1.7 μM, nH = 1.5 ± 0.1; α1Q241S: EC50 = 36.6 ± 1.5 μM, nH = 1.2 ± 0.1. The wild-type receptor data are from Li et al., 2006. (B) Wild-type and mutant receptors were activated by GABA in the presence of 10-1000 nM 3α5αP. The GABA concentration used corresponded to EC20-25 in the macroscopic dose-response curve, and was 5 μM for the wild-type receptor, 1 μM for α1Q241W, 20 μM for α1Q241L and 15 μM for the α1Q241S mutant receptor. The data points show mean ± SEM from 4-6 cells. Fitting to the Hill equation was conducted for data from the wild-type and α1Q241S receptors. The best-fit parameters for the wild-type are: maximal potentiation = 351 ± 4 %, EC50 = 41 ± 2 nM, nH = 1.2 ± 0.1. The best-fit parameters for the α1Q241S mutant receptor are: maximal potentiation = 350 ± 85 %, EC50 = 142 ± 173 nM, nH = 0.7 ± 0.3. Offset was fixed at 100 %. The test applications lasted 4 s and were separated from flanking control (GABA alone) applications by 30 s washouts.
Figure 3
Figure 3. Single-channel activity from the α1Q241W mutant receptor
Each section shows three consecutive 10 s segments at a specific concentration of GABA. Channel openings are shown as downward deflections. (A) Channel activation by 2 μM GABA resulted in isolated openings and brief (<0.5 s) bursts of openings. No clusters were evident. (B) Channel activation by 10 μM GABA resulted in high open probability clusters of activity (shown with lines underneath the current traces). In addition to the clusters, the record contained brief bursts of activity and isolated openings of unknown origin, which were not included in the kinetic analysis. (C) Channel activation by 50 μM GABA resulted in clusters of activity and isolated openings. The clusters were defined as long-lived (>0.5 s) groups of activity separated from each other by periods of inactivity, ignoring isolated openings, greater than 1 s.
Figure 4
Figure 4. The single-channel currents from the α1Q241W mutant receptor are not modulated by 3α5αP
(A) Sample single-channel currents elicited by 10 μM GABA, and the open and closed time histograms. The lower trace gives a portion of the current trace (shown with a thick line underneath the data trace) at higher resolution. The histograms were fitted to sums of three exponentials. The open times were 0.42 ms (19 %), 3.9 ms (19 %) and 9.3 ms (45 %). The closed times were 0.14 ms (56 %), 1.6 ms (29 %) and 21.7 ms (15 %). (B) Sample single-channel currents elicited by 10 μM GABA + 1 μM 3α5αP, and the open and closed time histograms. The lower trace gives a portion of the current trace at higher resolution. The histograms were fitted to sums of three exponentials. The open times were 0.29 ms (28 %), 5.7 ms (49 %) and 11.9 ms (23 %). The closed times were 0.13 ms (70 %), 2.2 ms (19 %) and 27.0 ms (11 %). The open and closed time parameters apply to the specific patch. Averaged values from multiple patches are given in the text.
Figure 5
Figure 5. The α1Q241W mutation affects channel activation by a low-efficacy agonist piperidine-4-sulfonic acid
(A) Sample single-channel activity from the wild-type receptor elicited by 1 mM P4S. No single-channel clusters were evident. Occasional overlaps seen in the data segment indicate that two or more channels contributed to the single-channel activity shown. The open times, measured from portions of the record without overlaps, were 0.18 ms (32 %) and 1.6 ms (68 %). No long duration openings (OT3) were apparent in the record. The closed times were 0.27 ms (24 %), 8.8 ms (30 %) and 30.3 ms (46 %). (B) Exposure of wild-type receptors to 1 mM P4S + 1 μM 3α5αP results in increased open time durations and the appearance of grouped openings, i.e., single-channel clusters. The intracluster open times were 0.15 ms (22 %), 1.3 ms (40 %) and 13.3 ms (38 %). The intracluster closed times were 0.22 ms (47 %), 1.8 ms (33 %) and 34.5 ms (20 %). (C) Exposure of the α1Q241W mutant receptor to 1 mM P4S elicits currents qualitatively similar to those from the wild-type receptor activated by P4S + 3α5αP. The intracluster open times were 0.55 ms (30 %), 4.3 ms (62 %) and 12.7 ms (8 %). The intracluster closed times were 0.17 ms (53 %), 2.0 ms (21 %) and 13.7 ms (26 %). The open and closed time parameters apply to the specific patch. Averaged values from multiple patches are given in the text.
Figure 6
Figure 6. The α1Q241W mutation does not affect channel inhibition by pregnenolone sulfate
(A) Sample macroscopic recordings from a cell expressing wild-type α1β2γ2L receptors. The receptors were activated by 1 mM GABA (a saturating concentration) in the absence and presence of 2, 10 or 50 μM pregnenolone sulfate (PS). The current decay phases were fitted by a single exponential to a constant level yielding 6794 ms (GABA), 4214 ms (GABA + 2 μM PS), 840 ms (GABA + 10 μM PS), and 464 ms (GABA + 50 μM PS). (B) Sample macroscopic recordings from a cell expressing α1Q241W mutant receptors. The receptors were activated by 250 μM GABA (a saturating concentration) in the absence and presence of 2, 10 or 50 μM PS. The current decay phases were fitted by a single exponential to a constant level yielding 3345 ms (GABA), 1268 ms (GABA + 2 μM PS), 864 ms (GABA + 10 μM PS), and 465 ms (GABA + 50 μM PS). (C) The relative area (total charge carried) of the macroscopic response as a function of PS concentration. The data points show mean ± SEM from 4-5 cells. The curves were fitted to: Y([steroid])=Y0 + (Ymax − Y0) [steroid]n/([steroid] + EC50)n. The best-fit parameters for the wild-type receptor were: Y0=100 % (constrained), Ymax = 15 ± 2 %, EC50 = 7.4 ± 0.4 μM, nH = 0.8 ± 0.1. The best-fit parameters for the α1Q241W mutant receptor were: Y0 = 100 % (constrained), Ymax = −12 ± 8 %, EC50 = 7.7 ± 2.2 μM, nH = 0.6 ± 0.1.
Figure 7
Figure 7. 3α5αP does not modulate single-channel activity from the α1Q241L mutant receptor
(A) A sample single-channel cluster elicited by 50 μM GABA, and the open and closed time histograms. The open times were 0.47 ms (26 %) and 2.1 ms (74 %). The closed times were 0.20 ms (58 %), 2.9 ms (15 %) and 13.0 ms (27 %). (B) A sample single-channel cluster elicited by 1000 μM GABA, and the open and closed time histograms. The open times were 0.82 ms (38 %) and 2.0 ms (62 %). The closed times were 0.19 ms (59 %), 0.9 ms (32 %) and 18.9 ms (9 %). (C) A sample single-channel cluster elicited by 50 μM GABA in the presence of 1 μM 3α5αP, and the open and closed time histograms. The open times were 0.60 ms (22 %) and 2.2 ms (78 %). The closed times were 0.18 ms (58 %), 1.4 ms (16 %) and 19.6 ms (26 %). The open and closed time parameters apply to the specific patch. Averaged values from multiple patches are given in the text.
Figure 8
Figure 8. Modulation of single-channel currents from the α1Q241S mutant receptor by 3α5αP
(A) A sample single-channel cluster elicited by 50 μM GABA, and the open and closed time histograms. The open times were 0.92 ms (63 %) and 2.1 ms (37 %). The closed times were 0.20 ms (72 %), 1.3 ms (9 %) and 19.2 ms (20 %). (B) A sample single-channel cluster elicited by 1000 μM GABA, and the open and closed time histograms. The open times were 0.72 ms (79 %) and 1.7 ms (21 %). The closed times were 0.21 ms (84 %), 1.0 ms (12 %) and 7.0 ms (3 %). (C) A sample single-channel cluster elicited by 50 μM GABA in the presence of 1 μM 3α5αP, and the open and closed time histograms. The open times were 0.61 ms (46 %) and 6.4 ms (54 %). The closed times were 0.18 ms (58 %), 1.9 ms (27 %) and 10.9 ms (15 %). The open and closed time parameters apply to the specific patch. Averaged values from multiple patches are given in the text.
Figure 9
Figure 9. The α1Q241L mutation does not affect potentiation by the steroid analogue 3αCH2OH5βP
(A) Structure of the steroid analogue 3αHOCH25βP. (B)Potentiation dose-response curves for wild-type and α1Q241L mutant receptors. The data points show mean ± SEM from 4-5 cells. Due to absence of saturation no curve fitting was attempted. (C) Sample macroscopic recordings from a cell expressing wild-type α1β2γ2L receptors. The receptors were activated by 5 μM GABA in the absence and presence of 10 μM 3αCH2OH5βP. The peak responses in this cell were 581 pA (GABA), and 1346 pA (GABA + steroid). (D) Sample macroscopic recordings from a cell expressing α1Q241L mutant receptors. The receptors were activated by 20 μM GABA in the absence and presence of 10 μM 3αCH2OH5βP. The peak responses in this cell were 559 pA (GABA), and 1480 pA (GABA + steroid).
Figure 10
Figure 10. Potentiation by 3αCH2OH5βP is abolished in the α1S240L and α1W245L mutant receptors
(A) Wild-type and mutant receptors were activated by GABA, and the mean fractional peak responses (± SEM) from 5-7 cells are plotted as a function of GABA concentration. Curve fitting to the Hill equation yields the following parameters. α1S240L: EC50 = 38.1 ± 4.3 μM, nH = 1.3 ± 0.2; α1W245L: EC50 = 23.8 ± 1.6 μM, nH = 1.0 ± 0.1. The wild-type receptor data (dashed line) are replotted from Figure 1A. (B) Comparison of potentiation of wild-type, α1S240L, α1S241L, and α1W245L mutant receptors by 3α5αP or 3αCH2OH5βP. The data (mean ± SEM) show the levels of potentiation by 3 μM 3α5αP (1 μM for wild-type and α1Q241L) or 10 μM 3αCH2OH5βP of currents elicited by an EC15-25 concentration of GABA. Statistical tests (Student's t-test) were carried out with respect to control (GABA alone), and to steroid-mediated potentiation of the wild-type receptor. *, P<0.05; **, P<0.01; ***, P<0.001; ns, not significant; −, not applicable. (C) Sample macroscopic recordings from a cell expressing α1S240L mutant receptors. The receptors were activated by 10 μM GABA in the absence and presence of 10 μM 3αCH2OH5βP or 3 μM 3α5αP. The peak responses in this cell were 55 pA (10 μM GABA), 57 pA (10 μM GABA + 10 μM 3αCH2OH5βP), and 210 pA (10 μM GABA + 3 μM 3α5αP). (D) Sample macroscopic recordings from a cell expressing α1W245L mutant receptors. The receptors were activated by 5 μM GABA in the absence and presence of 10 μM 3αCH2OH5βP or 3 μM 3α5αP. The peak responses in this cell were 352 pA (10 μM GABA), 311 pA (5 μM GABA + 10 μM 3αCH2OH5βP), and 412 pA (5 μM GABA + 3 μM 3α5αP).
Figure 11
Figure 11. Effects of mutations to the M1 domain on potentiation by 3α5αP
Comparison of potentiation of wild-type, and α1S240L, α1Q241L, α1S243L and α1W245L mutant receptors by 3α5βP. The data (mean ± SEM) from 3-6 cells show the levels of potentiation by 3 μM 3α5βP of currents elicited by an EC15-25 concentration of GABA. Statistical tests (Student's t-test) were carried out with respect to control (GABA alone), and to 3α5βP-mediated potentiation of the wild-type receptor. *, P<0.05; **, P<0.01; ***, P<0.001; ns, not significant; −, not applicable.
Figure 12
Figure 12. Steroid 3deoxy5αP potentiates the wild-type but not the α1Q241L mutant receptor
(A) Structure of the steroid analogue 3deoxy5αP. (B) Comparison of potentiation of the wild-type receptor and the α1Q241L mutant receptor by 1 μM 3deoxy5αP. The data show mean ± SEM from 5-7 cells. (C) Sample macroscopic recordings from a cell expressing wild-type receptors. The receptors were activated by 5 μM GABA in the absence and presence of 1 μM 3deoxy5αP. The peak responses in this cell were 114 pA (GABA), and 281 pA (GABA + 3deoxy5αP). (D) Sample macroscopic recordings from a cell expressing α1Q241L mutant receptors. The receptors were activated by 20 μM GABA in the absence and presence of 1 μM 3deoxy5αP. The peak responses in this cell were 317 pA (GABA), and 305 pA (GABA + 3deoxy5αP).
Figure 13
Figure 13
The DOPE plots of the M1 domains of the wild-type (solid line), α1Q241W (dashed line), and α1Q241L mutant receptor (dotted) over a 13 residue evaluation window. Negative scores show a favorable trend to the idealized reference state, while positive scores indicate unfavorable deviations from the reference state. There were only minimal changes in the scores arising from the mutations.

References

    1. Akk G, Bracamontes J, Steinbach JH. Pregnenolone sulfate block of GABAA receptors: mechanism and involvement of a residue in the M2 region of the α subunit. J Physiol. 2001;532:673–684. - PMC - PubMed
    1. Akk G, Bracamontes JR, Covey DF, Evers A, Dao T, Steinbach JH. Neuroactive steroids have multiple actions to potentiate GABAA receptors. J Physiol. 2004;558:59–74. - PMC - PubMed
    1. Akk G, Shu HJ, Wang C, Steinbach JH, Zorumski CF, Covey DF, Mennerick S. Neurosteroid access to the GABAA receptor. J Neurosci. 2005;25:11605–11613. - PMC - PubMed
    1. Boileau AJ, Li T, Benkwitz C, Czajkowski C, Pearce RA. Effects of the γ2S subunit incorporation on GABAA receptor macroscopic kinetics. Neuropharmacol. 2003;44:1003–1012. - PubMed
    1. Brejc K, van Dijk WJ, Klaassen RV, Schuurmans M, van Der Oost J, Smit AB, Sixma TK. Crystal structure of an ACh-binding protein reveals the ligand-binding domain of nicotinic receptors. Nature. 2001;411:269–276. - PubMed

Publication types

MeSH terms