

Morphometric changes in the episodic memory network and tau pathologic features correlate with memory performance in patients with mild cognitive impairment
- PMID: 18544670
- PMCID: PMC8118812
- DOI: 10.3174/ajnr.A1059
Morphometric changes in the episodic memory network and tau pathologic features correlate with memory performance in patients with mild cognitive impairment
Abstract
Background and purpose: Mild cognitive impairment (MCI) may affect several cognitive domains, including attention and reasoning, but is often first characterized by memory deficits. The purpose of this study was to ask these 2 questions: 1) Can levels of CSF tau proteins and amyloid beta 42 peptide explain thinning of the cerebral cortex in patients with MCI? 2) How are brain morphometry, CSF biomarkers, and apolipoprotein E (APOE) allelic variation related to episodic memory function in MCI?
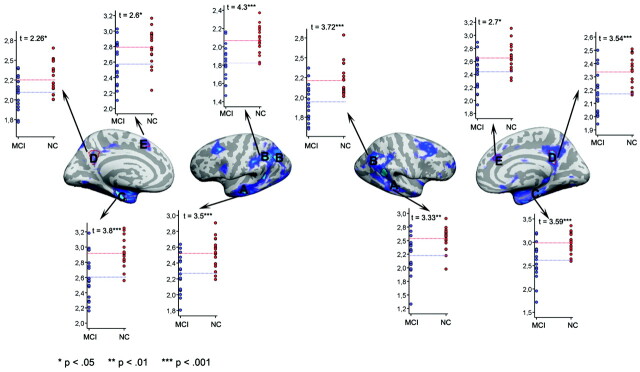
Materials and methods: Hippocampal volume and cortical thickness were estimated by MR imaging and compared for patients with MCI (n = 18) and healthy controls (n = 18). In addition, regions of interest (ROIs) were selected in areas where the MCI group had atrophy and which overlapped with the episodic memory network (temporal, entorhinal, inferior parietal, precuneus/posterior cingulate, and frontal). Relationships among morphometry, CSF biomarkers, APOE, and memory were tested. The analyses were repeated with an independent sample of patients with MCI (n = 19).
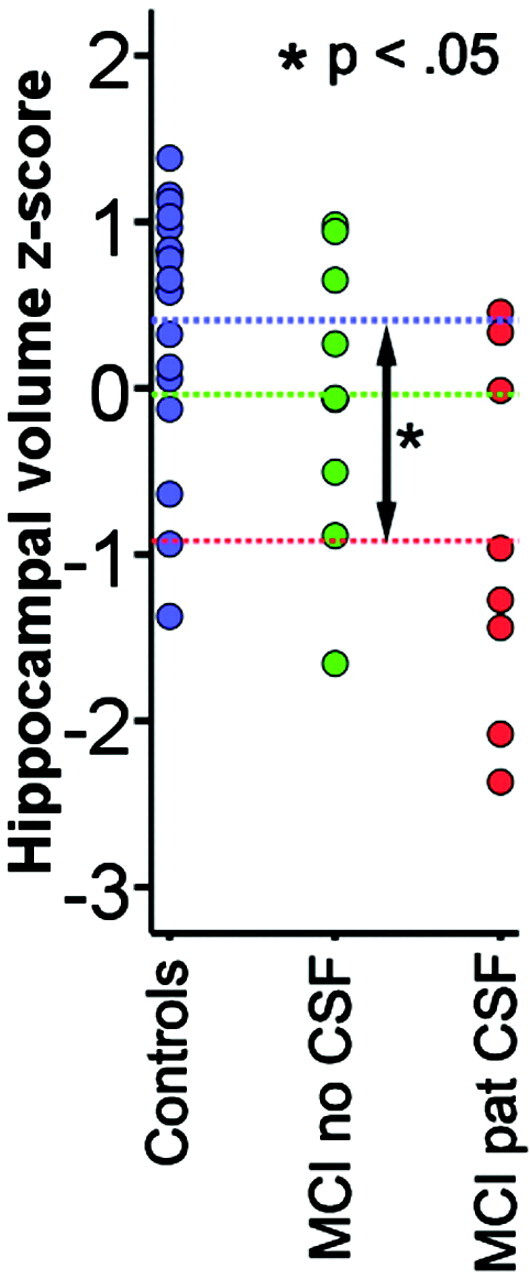
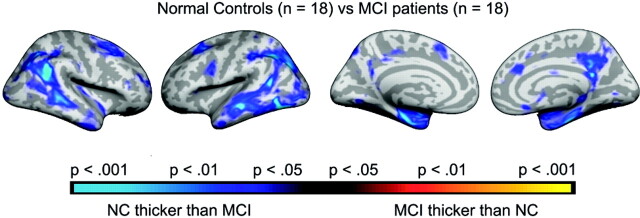
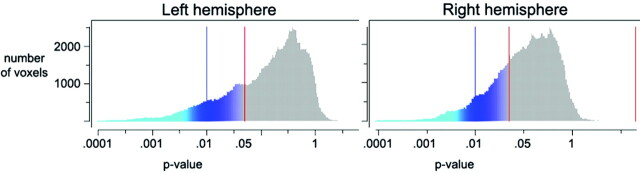
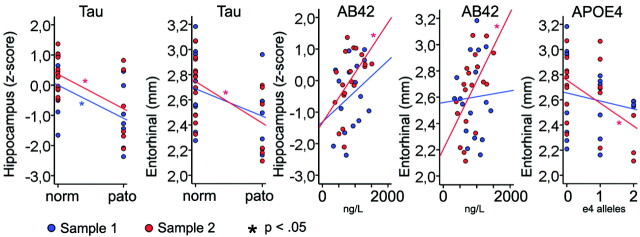
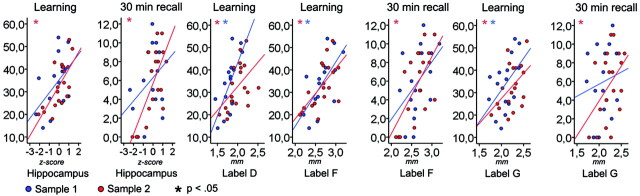
Results: Patients with MCI and pathologic CSF values had hippocampal atrophy. However, both patients with pathologic and patients with nonpathologic CSF had a thinner cortex outside the hippocampal area. CSF pathology was related to hippocampal volume, whereas relationships with cortical thickness were found mainly in one of the samples. Morphometry correlated robustly with memory performance across MCI samples, whereas less stable results were found for tau protein.
Conclusion: The differences in hippocampal volume between the MCI and the healthy control groups were only found in patients with pathologic CSF biomarkers, whereas differences in cortical thickness were also found for patients without such pathologic features. Morphometry in areas in the episodic memory network was robustly correlated with memory performance. It is speculated that atrophy in these areas may be associated with the memory problems seen in MCI.
Figures
References
-
- Petersen RC, Stevens JC, Ganguli M, et al. Practice parameter: early detection of dementia: mild cognitive impairment (an evidence-based review). Report of the Quality Standards Subcommittee of the American Academy of Neurology. Neurology 2001;56:1133–42 - PubMed
-
- Bell-McGinty S, Lopez OL, Meltzer CC, et al. Differential cortical atrophy in subgroups of mild cognitive impairment. Arch Neurol 2005;62:1393–97 - PubMed
-
- Karas GB, Scheltens P, Rombouts SA, et al. Global and local gray matter loss in mild cognitive impairment and Alzheimer's disease. NeuroImage 2004;23:708–16 - PubMed
-
- Singh V, Chertkow H, Lerch JP, et al. Spatial patterns of cortical thinning in mild cognitive impairment and Alzheimer's disease. Brain 2006;129:2885–93 - PubMed
Publication types
MeSH terms
Substances
LinkOut - more resources
Full Text Sources
Medical
Miscellaneous