. 2008 Sep;57(9):2296-303.
doi: 10.2337/db08-0379. Epub 2008 Jun 10.

Carcinoembryonic antigen-related cell adhesion molecule 1: a link between insulin and lipid metabolism

Affiliations

Carcinoembryonic antigen-related cell adhesion molecule 1: a link between insulin and lipid metabolism

Anthony M DeAngelis et al. Diabetes. 2008 Sep.

Abstract

Objective: Liver-specific inactivation of carcinoembryonic antigen-related cell adhesion molecule 1 (CEACAM1) by a dominant-negative transgene (l-SACC1 mice) impaired insulin clearance, caused insulin resistance, and increased hepatic lipogenesis. To discern whether this phenotype reflects a physiological function of CEACAM1 rather than the effect of the dominant-negative transgene, we characterized the metabolic phenotype of mice with null mutation of the Ceacam1 gene (Cc1(-/-)).

Research design and methods: Mice were originally generated on a mixed C57BL/6x129sv genetic background and then backcrossed 12 times onto the C57BL/6 background. More than 70 male mice of each of the Cc1(-/-) and wild-type Cc1(+/+) groups were subjected to metabolic analyses, including insulin tolerance, hyperinsulinemic-euglycemic clamp studies, insulin secretion in response to glucose, and determination of fasting serum insulin, C-peptide, triglyceride, and free fatty acid levels.

Results: Like l-SACC1, Cc1(-/-) mice exhibited impairment of insulin clearance and hyperinsulinemia, which caused insulin resistance beginning at 2 months of age, when the mutation was maintained on a mixed C57BL/6x129sv background, but not until 5-6 months of age on a homogeneous inbred C57BL/6 genetic background. Hyperinsulinemic-euglycemic clamp studies revealed that the inbred Cc1(-/-) mice developed insulin resistance primarily in liver. Despite substantial expression of CEACAM1 in pancreatic beta-cells, insulin secretion in response to glucose in vivo and in isolated islets was normal in Cc1(-/-) mice (inbred and outbred strains).

Conclusions: Intact insulin secretion in response to glucose and impairment of insulin clearance in l-SACC1 and Cc1(-/-) mice suggest that the principal role of CEACAM1 in insulin action is to mediate insulin clearance in liver.


Figures

FIG. 1.
FIG. 1.
Insulin tolerance test in inbred mice. Glucose levels were measured in venous blood extracted from overnight-fasted 2- and 6-month-old age-matched wild-type (Cc1+/+, ○) and Cc1 knockout mice (Cc1−/−, •) following an intraperitoneal injection with insulin (0.125 unit/kg) for 0–5 h. Experiments were performed on n ≥ 10 per group. Values expressed as means ± SE. *P < 0.05 vs. Cc1+/+.
FIG. 2.
FIG. 2.
Insulin response during hyperinsulinemic-euglycemic clamps in awake inbred mice. Five- to 6-month-old wild-type Cc1+/+ (□) and Cc1−/− mice (▪) (n ≥ 10 per group) were subjected to clamp analysis. A: Steady-state glucose infusion rates during euglycemic clamps. B: Insulin-stimulated whole-body glycogen synthesis. C: Insulin-stimulated whole-body glucose turnover. D: HGP during basal and insulin-stimulated (clamp) states. E: Hepatic insulin action represented as insulin-mediated percent suppression of HGP. F: Insulin-stimulated glucose uptake in skeletal muscle (gastrocnemius). G: Skeletal muscle glycogen synthesis. H: Insulin-stimulated glucose uptake in white adipose tissue (WAT). Values (all in nmol · g−1 · min−1) are expressed as means ± SE. *P < 0.05 vs. Cc1+/+.
FIG. 3.
FIG. 3.
Northern blot analysis and quantitation of glucose intermediates in livers of inbred mice. Livers from 6-month-old wild-type Cc1+/+ (□) and Cc1−/− mice (▪) (n ≥ 7 per group) were isolated for mRNA analysis by Northern blot (A) and determination of hepatic G6P levels (B). Representative Northern gels from analysis of mRNA levels at fasting and fed states are shown normalized to β-actin. Values expressed as means ± SE. *P < 0.05 vs. Cc1+/+.
FIG. 4.
FIG. 4.
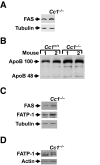
Western blot analysis of proteins involved in lipid homeostasis in inbred mice. Tissues (A, C, and D) were removed from 6-month-old inbred Cc1−/− mice (n ≥ 5 per group), and lysates were analyzed by 7% SDS-PAGE and sequential immunoblotting with α-FAS and α-FATP-1 antibodies followed by reprobing with α-tubulin or α-actin antibodies to account for the amount of proteins analyzed. B: Serum was diluted and analyzed by 4–10% gradient SDS-PAGE and immunoblotting with an antibody against apolipoprotein (apo)B, which recognizes both apoB48 and apoB100. A representative gel of five to six mice per group is included.
FIG. 5.
FIG. 5.
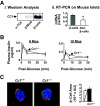
The effect of Ceacam1 on insulin secretion and β-cell area. A: i, CEACAM1 protein content in immortalized β-cell islets from βIRKO mice and in α-TC6 and β-Min6 cells was analyzed by Western blot analysis using an antibody against mouse CEACAM1. ii, Ceacam1 mRNA levels were determined in FACS-purified β-cells and non–β-cells derived from a normal mouse by real-time PCR analysis. Data are normalized for β-actin and expressed as fold change. B: Insulin levels in response to glucose were measured for 0–30 min after intraperitoneal injection of age-matched 6- and 10-month-old inbred Cc1+/+ (○) and Cc1−/− mice (•). Experiments were performed on n ≥ 7 per group. Values are expressed as means ± SE. *P < 0.05 vs. Cc1+/+. C: Pancreas sections from four each of the 6-month-old inbred Cc1+/+ and Cc1−/− mice were fixed and immunostained with antibodies against insulin (blue), glucagon (red), and somatostatin (green). β-Cell area was estimated by morphometric analysis of 44 islets from Cc1+/+ and 33 from Cc1−/− mice. Values expressed as means ± SE in arbitrary units (AU) are presented in the graph. Magnification ×20. (Please see http://dx.doi.org/10.2337/db08-0379 for a high-quality digital representation of this figure.)
FIG. 6.
FIG. 6.
Insulin resistance in outbred C57BL/6x129sv mice. A: For insulin tolerance, glucose levels were measured in venous blood extracted from overnight-fasted 6-month-old age-matched wild-type Cc1+/+ (○) and Cc1−/− mice (•) injected intraperitoneally with 0.125 units/kg insulin for 0–3 h. Experiments were performed on n ≥ 9 per group. Values are expressed as means ± SE. *P < 0.05 vs. Cc1+/+. B: For glucose tolerance test, blood glucose level was determined in overnight-fasted 2-month-old Cc1+/+ (○) and Cc1−/− mice (•) mice at 0–120 min after intraperitoneal glucose injection (2 g/kg). Six to 11 mice were used in each group. Values are expressed as means ± SE. *P < 0.05 vs. Cc1+/+. C: For Western blot analysis of insulin receptor phosphorylation, liver lysates of 2-month-old outbred Cc1−/− and Cc1+/+ controls were incubated with (+) or without (−) 100 nmol/l insulin. The IRβ was immunoprecipitated (Ip), analyzed by 7% SDS-PAGE, and transferred to nitrocellulose membrane for immunoblotting (Ib) with horseradish peroxidase–conjugated phosphotyrosine (α-pTyr) antibody (i). Membranes were reprobed (reIb) with α-IRβ antibody to account for the amount of insulin receptor in the immunopellets (ii). The gel is representative of three different experiments each performed on two mice per treatment per group. D: Islets were isolated from 6-month-old wild-type Cc1+/+ (□) and Cc1−/− mice (▪) (n > 3 per group) by collagenase digestion followed by centrifugation over histopaque gradient. Recovered islets were cultured overnight in RPMI containing 5.5 nmol/l glucose. Insulin secretion was assayed by incubating 10 islets in Kreb's buffer containing different concentrations of glucose or 20 mmol/l KCl for 1 h. Amount of insulin secreted was normalized with DNA content, and values are expressed as means ± SE.

Similar articles

Cited by

References

    1. Duckworth WC, Bennett RG, Hamel FG: Insulin degradation: progress and potential. Endocrinol Rev 19 :608 –624,1998 - PubMed
    1. Shillabeer G, Hornford J, Forden JM, Wong NC, Russell JC, Lau DC: Fatty acid synthase and adipsin mRNA levels in obese and lean JCR:LA-cp rats: effect of diet. J Lipid Res 33 :31 –39,1992 - PubMed
    1. Assimacopoulos-Jeannet F, Brichard S, Rencurel F, Cusin I, Jeanrenaud B: In vivo effects of hyperinsulinemia on lipogenic enzymes and glucose transporter expression in rat liver and adipose tissues. Metabolism 44 :228 –233,1995 - PubMed
    1. Rabkin R, Ryan MP, Duckworth WC: The renal metabollism of insulin. Diabetologia 27 :351 –357,1984 - PubMed
    1. Formisano P, Najjar SM, Gross CN, Philippe N, Oriente F, Kern BCL, Accili D, Gorden P: Receptor-mediated internalization of insulin: potential role of pp120/HA4, a substrate of the insulin receptor kinase. J Biol Chem 270 :24073 –24077,1995 - PubMed

Publication types