. 2008 Jun 18;100(12):888-97.
doi: 10.1093/jnci/djn175. Epub 2008 Jun 10.

Evaluation of trends in the cost of initial cancer treatment

Affiliations

Evaluation of trends in the cost of initial cancer treatment

Joan L Warren et al. J Natl Cancer Inst. .

Abstract

Background: Despite reports of increases in the cost of cancer treatment, little is known about how costs of cancer treatment have changed over time and what services have contributed to the increases.

Methods: We used data from the Surveillance, Epidemiology, and End Results (SEER)-Medicare linked database for 306,709 persons aged 65 and older and diagnosed with breast, lung, colorectal, or prostate cancer between 1991 and 2002 to assess the number of patients assigned to initial cancer care, from 2 months before diagnosis to 12 months after diagnosis, and mean annual Medicare payments for this care according to cancer type and type of treatment. Mutually exclusive treatment categories were cancer-related surgery, chemotherapy, radiation therapy, and other hospitalizations during the period of initial cancer care. Linear regression models were used to assess temporal trends in the percentage of patients receiving treatment and costs for those treated. We extrapolated our results based on the SEER data to the US Medicare population to estimate national Medicare payments by cancer site and treatment category. All statistical tests were two-sided.

Results: For patients diagnosed in 2002, Medicare paid an average of $39,891 for initial care for each lung cancer patient, $41 134 for each colorectal cancer patient, and $20,964 for each breast cancer patient, corresponding to inflation-adjusted increases from 1991 of $7139, $5345, and $4189, respectively. During the same interval, the mean Medicare payment for initial care for prostate cancer declined by $196 to $18261 in 2002. Costs for any hospitalization accounted for the largest portion of payments for all cancers. Chemotherapy use increased markedly for all cancers between 1991 and 2002, as did radiation therapy use (except for colorectal cancers). Total 2002 Medicare payments for initial care for these four cancers exceeded $6.7 billion, with colorectal and lung cancers being the most costly overall.

Conclusions: The statistically significant increase in costs of initial cancer treatment reflects more patients receiving surgery and adjuvant therapy and rising prices for these treatments. These trends are likely to continue in the near future, although more efficient targeting of costly therapies could mitigate the overall economic impact of this trend.


Figures

Figure 1
Figure 1
Trends in the mean Medicare payment in constant 2003 dollars during the initial year of treatment. Data are shown for breast, lung, colorectal, and prostate cancer patients in the Surveillance, Epidemiology, and End Results areas for 1991 through 2002. The parameter estimate for slopes (dollars per year) were as follows. Breast: 310, 95% confidence interval (CI) = 217 to 404, P < .001; lung: 598, 95% CI = 440 to 755, P < .001; colorectal: 472, 95% CI = 237 to 706, P = .001; prostate: −11, 95% CI = −114 to 92, P = .818.
Figure 2
Figure 2
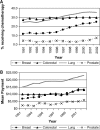
Trends in the percent of fee-for-service Medicare beneficiaries undergoing cancer-related surgery and the mean Medicare payment in constant 2003 dollars during the initial year of treatment. Data are shown for breast, lung, colorectal, and prostate cancer patients in the Surveillance, Epidemiology, and End Results areas for 1991 through 2002. A) Parameter estimate for slopes (proportions receiving surgery per year) were as follows. Breast: 0.03, 95% confidence interval (CI) = −0.08 to 0.14, P = .635; lung: −0.84, 95% CI = −1.02 to −0.67, P < .001; colorectal: 0.05, 95% CI = −0.05 to 0.15, P = .318; prostate: −2.5, 95% CI = −3.0 to −2.1, P < .001. B)Parameter estimate for slopes (dollars per year) were as follows. Breast: −168, 95% CI = −199 to −138, P < .001; lung: 193, 95% CI = 83 to 302, P =.003; colorectal: 156, 95% CI = −14 to 326, P = .069; prostate: −137, 95% CI = −258 to −16, P = .030.
Figure 3
Figure 3
Trends in the percent of fee-for-service Medicare beneficiaries receiving chemotherapy and the mean Medicare payment in constant 2003 dollars during the initial year of treatment. Data are shown for breast, lung, colorectal, and prostate cancer patients in the Surveillance, Epidemiology, and End Results areas for 1991 through 2002. A) Parameter estimate for slopes (proportions receiving chemotherapy per year) were as follows. Breast: 1.3, 95% confidence interval (CI) = 1.01 to 1.58, P < .001; lung: 1.23, 95% CI = 1.03 to 1.43, P < .001; colorectal: 0.20, 95% CI = 0.09 to 0.30, P = .002; prostate: 0.15, 95% CI = −0.03 to 0.35, P = .090. B) Parameter estimate for slopes (dollars per year) were as follows. Breast: 550, 95% CI = 429 to 670, P < .001; lung: 636, 95% CI = 519 to 752, P < .001; colorectal: 280, 95% CI = 113 to 446, P = .004; prostate: 325, 95% CI = 218 to 433, P < .001.
Figure 4
Figure 4
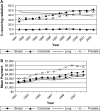
Trends in the percent of fee-for-service Medicare beneficiaries receiving radiation therapy and the mean Medicare payment in constant 2003 dollars during the initial year of treatment. Data are shown for breast, lung, colorectal, and prostate cancer patients in the Surveillance, Epidemiology, and End Results areas for 1991 through 2002. A) Parameter estimate for slopes (proportions receiving radiation therapy per year) were as follows. Breast: 2.3, 95% confidence interval (CI) = 1.98 to 2.53, P < .001; lung: −0.73, 95% CI = −0.82 to −0.64, P < .001; colorectal: .003, 95% CI = −0.09 to 0.09, P = .952; prostate: 1.40, 95% CI = 0.95 to 1.84, P < .001. B) Parameter estimate for slopes (dollars per year) were as follows. Breast: 195, 95% CI = 168 to 222, P < .001; lung: 132, 95% CI = 105 to 159, P < .001; colorectal: 147, 95% CI = 110 to 183, P < .001; prostate: 283, 95% CI = 238 to 327, P < .001.
Figure 5
Figure 5
Trends in the percent of fee-for-service Medicare beneficiaries with other hospitalizations (ie, for reasons other than cancer surgery) and the mean Medicare payment for those hospitalized in constant 2003 dollars during the initial year of treatment. Data are shown for breast, lung, colorectal, and prostate cancer patients in the Surveillance, Epidemiology, and End Results areas for 1991 through 2002. A) Parameter estimate for slopes (proportions with other hospitalizations per year) were as follows. Breast: −0.17, 95% confidence interval (CI) = −0.30 to −0.05, P = .009; lung: −0.22, 95% CI = −0.36 to −0.09, P = .005; colorectal: 0.20, 95% CI = 0.10 to 0.31, P = .002; prostate: −0.79; 95% CI = −1.03 to −0.56, P < .001. B) Parameter estimate for slopes (dollars per year) were as follows. Breast: 169, 95% CI = 17 to 322, P = .033; lung: 126, 95% CI = 23 to 229, P = .022; colorectal: 187, 95% CI = 29 to 345, P = .025; prostate: 119, 95% CI = −77 to 316, P = .205.

References

    1. Cancer Trends Progress Report—2005 Update. Bethesda, MD: National Cancer Institute, NIH, DHHS; December 2005. http://progressreport.cancer.gov Accessed March 27, 2008.
    1. Ries LAG, Eisner MP, Kosary CL. SEER Cancer Statistics Review, 1975–2002. Bethesda, MD: National Cancer Institute; 2008. Based on November 2004 SEER data submission, posted to the SEER Web site 2005. http://seer.cancer.gov/csr/1975_2002/ Accessed March 27.
    1. Surveillance, Epidemiology, and End Results (SEER) Program SEER*Stat Database: Incidence—SEER 13 Regs Public-Use, Nov 2005 Sub (1992–2003)—Linked to County Attributes—Total US, 1969–2003 Counties. National Cancer Institute, DCCPS, Surveillance Research Program, Cancer Statistics Branch, Bethesda, MD, released April 2006, based on the November 2005 submission. http://www.seer.cancer.gov. Accessed March 27, 2008.
    1. Brown ML, Riley GF, Schussler N, Etzioni R. Estimating health care costs related to cancer treatment from SEER-Medicare data. Med Care. 2002;40 IV-104-17. - PubMed
    1. Warren JL, Brown ML, Fay MP, Schussler N, Potosky AL, Riley GF. Costs of treatment for elderly women with early-stage breast cancer in fee-for-service settings. J Clin Oncol. 2002;20(1):307–316. - PubMed

MeSH terms