

Evaluation of Dynabeads and Cytospheres compared with flow cytometry to enumerate CD4+ T cells in HIV-infected Ugandans on antiretroviral therapy
- PMID: 18545154
- PMCID: PMC2664851
- DOI: 10.1097/QAI.0b013e31817bbc3a
Evaluation of Dynabeads and Cytospheres compared with flow cytometry to enumerate CD4+ T cells in HIV-infected Ugandans on antiretroviral therapy
Abstract
Background: Laboratory-based monitoring of antiretroviral therapy is essential but adds a significant cost to HIV care. The World Health Organization 2006 guidelines support the use of CD4 lymphocyte count (CD4) to define treatment failure in resource-limited settings.
Methods: We compared CD4 obtained on replicate samples from 497 HIV-positive Ugandans (before and during ART) followed for 18 months by 2 manual bead-based assays, Dynabeads (Dynal Biotech), and Cytospheres (Beckman Coulter) with those generated by flow cytometry at the Infectious Diseases Institute in Kampala, Uganda.
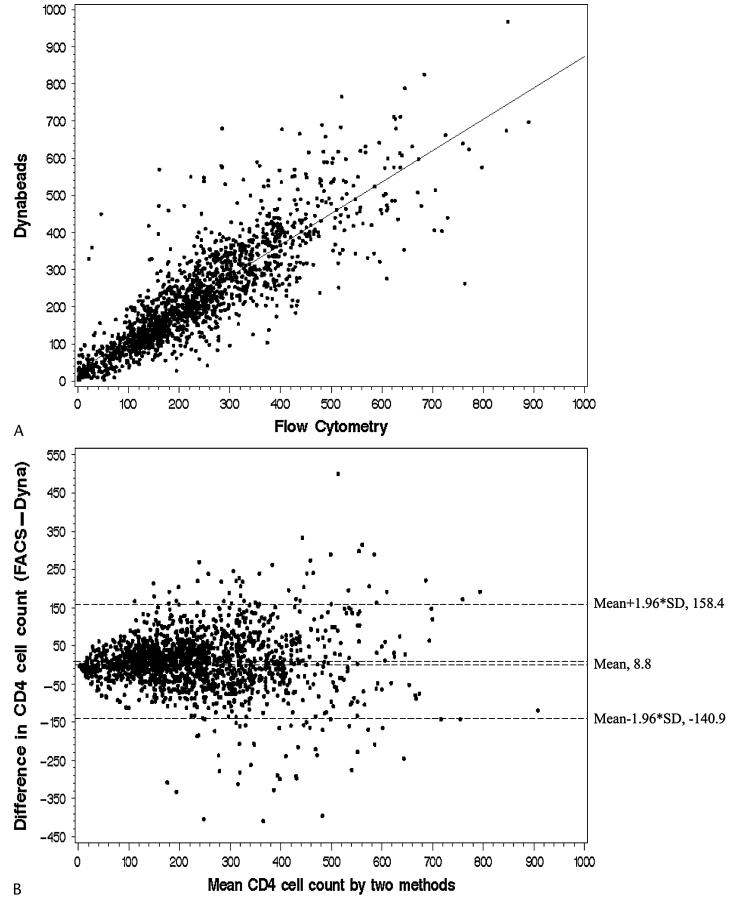
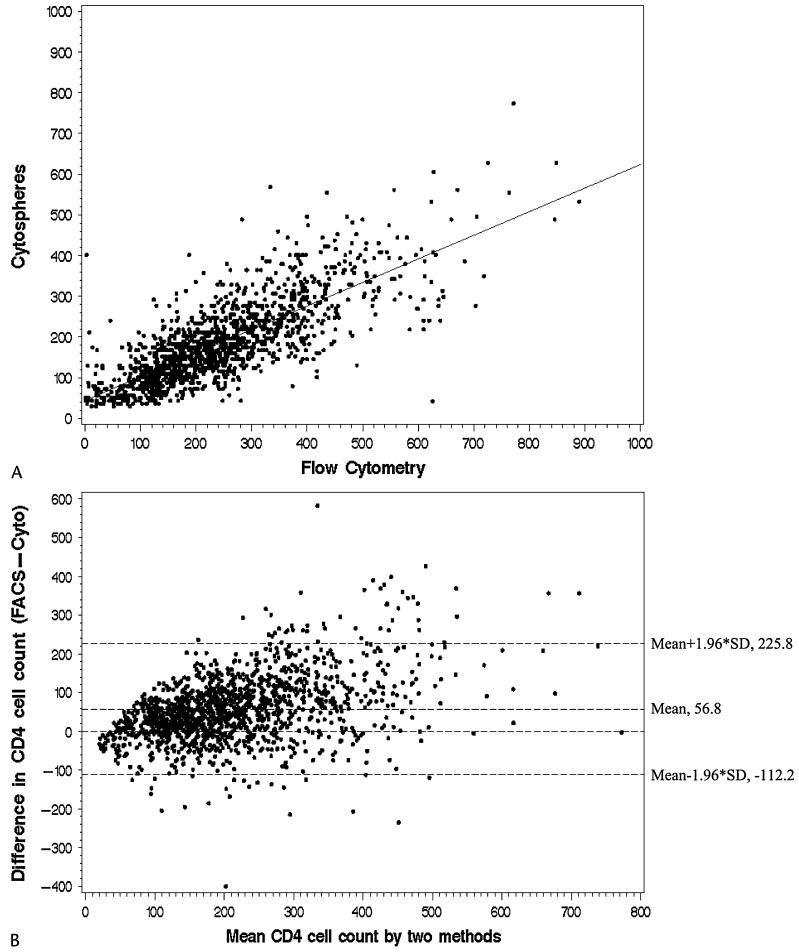
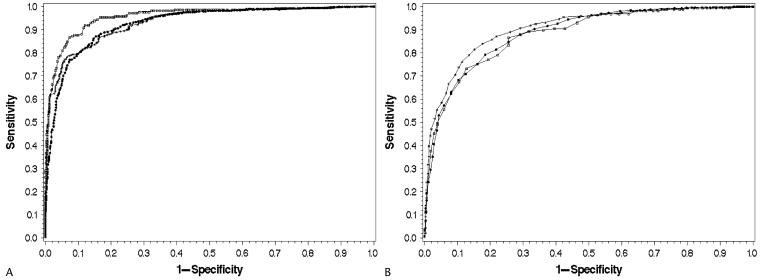
Results: We tested 1671 samples (123 before ART) with Dynabeads and 1444 samples (91 before ART) with Cytospheres. Mean CD4 was 231 cells/mm (SD, 139) and 239 cells/mm (SD, 140) by Dynabeads and flow cytometry, respectively. Mean CD4 was 186 cells/mm (SD, 101) and 242 cells/mm (SD, 136) by Cytospheres and flow cytometry, respectively. The mean difference in CD4 count by flow cytometry versus Dynabeads were 8.8 cells/mm (SD, 76.0) and versus Cytospheres were 56.8 cells/mm (SD, 85.8). The limits of agreement were -140.9 to 158.4 cells/mm for Dynabeads and -112.2 to 225.8 cells/mm for Cytospheres. Linear regression analysis showed higher correlation between flow cytometry and Dynabeads (r=0.85, r=0.73, slope=0.85, intercept=28) compared with the correlation between flow cytometry and Cytospheres (r=0.78, r=0.60, slope=0.58, intercept=45). Area under the receiver operating characteristics curve to predict CD4<200 cells/mm was 0.928 for Dynabeads and 0.886 for Cytospheres.
Conclusion: Although Dynabeads and Cytospheres both underestimated CD4 lymphocyte count compared with flow cytometry, in resource-limited settings with low daily throughput, manual bead-based assays may provide a less expensive alternative to flow cytometry.
Figures
Similar articles
-
Evaluation of a manual CD4+ count kit for determination of absolute CD4+ T-lymphocyte counts.J Med Assoc Thai. 2008 Oct;91(10):1495-8. J Med Assoc Thai. 2008. PMID: 18972890
-
Efficacy of Cyto-Chex blood preservative for delayed manual CD4 testing using Dynal T4 Quant CD4 test among HIV-infected persons in Zambia.J Acquir Immune Defic Syndr. 2006 Feb 1;41(2):168-74. doi: 10.1097/01.qai.0000191282.77954.fc. J Acquir Immune Defic Syndr. 2006. PMID: 16394848
-
Modified Dynabeads method for enumerating CD4+ T-lymphocyte count for widespread use in resource-limited situations.J Acquir Immune Defic Syndr. 2005 Jan 1;38(1):1-4. doi: 10.1097/00126334-200501010-00001. J Acquir Immune Defic Syndr. 2005. PMID: 15608516
-
Thirty-five years of CD4 T-cell counting in HIV infection: From flow cytometry in the lab to point-of-care testing in the field.Cytometry B Clin Cytom. 2017 Nov;92(6):437-444. doi: 10.1002/cyto.b.21400. Epub 2016 Aug 3. Cytometry B Clin Cytom. 2017. PMID: 27406947 Review.
-
Evaluation of a flow cytometry method for CD4 T cell enumeration based on volumetric primary CD4 gating using thermoresistant reagents.J Immunol Methods. 2011 Sep 30;372(1-2):7-13. doi: 10.1016/j.jim.2011.07.012. Epub 2011 Jul 29. J Immunol Methods. 2011. PMID: 21835181 Review.
Cited by
-
Microparticle-tagged image-based cell counting (ImmunoSpin) for CD4 + T cells.Mikrochim Acta. 2021 Nov 25;188(12):431. doi: 10.1007/s00604-021-05070-y. Mikrochim Acta. 2021. PMID: 34822013 Free PMC article.
-
CD4 immunophenotyping in HIV infection.Nat Rev Microbiol. 2008 Nov;6(11 Suppl):S7-15. doi: 10.1038/nrmicro1998. Nat Rev Microbiol. 2008. PMID: 18923413 Free PMC article. Review.
-
CD4 enumeration technologies: a systematic review of test performance for determining eligibility for antiretroviral therapy.PLoS One. 2015 Mar 19;10(3):e0115019. doi: 10.1371/journal.pone.0115019. eCollection 2015. PLoS One. 2015. PMID: 25790185 Free PMC article.
-
Characterization of a new simian immunodeficiency virus strain in a naturally infected Pan troglodytes troglodytes chimpanzee with AIDS related symptoms.Retrovirology. 2011 Jan 13;8:4. doi: 10.1186/1742-4690-8-4. Retrovirology. 2011. PMID: 21232091 Free PMC article.
-
The effects of setarud on the immunological status of HIV-positive patients: Efficacy of a novel multi-herbal drug.Avicenna J Phytomed. 2017 May-Jun;7(3):232-241. Avicenna J Phytomed. 2017. PMID: 28748170 Free PMC article.
References
-
- UNAIDS. WHO . AIDS Epidemic Update: Special Report on HIV/AIDS, December 2007. WHO; Geneva, Switzerland: 2007. [Accessed January 6, 2008]. 1-6-0008. Available at: http://data.unaids.org/pub/EPISlides/2007/2007_epiupdate_en.pdf.
-
- Deghaye N, Pawinski RA, Desmond C. Financial and economic costs of scaling up the provision of HAART to HIV-infected health care workers in KwaZulu-Natal. S Afr Med J. 2006;96:140–143. - PubMed
-
- Cost of ARVs makes up less than one third of treatment cost in South African study. Aidsmap News. 2006. [Accessed May 15, 2008]. 11-30-2006. Available at http://www.nam.org.uk/en/news/385FF3E4-19E1-4015-9BCE-2EACE67E9FBB.asp.
-
- World Health Organization . Scaling up Antiretroviral Therapy in Resource-Limited Settings: Treatment Guidelines for a Public Health Approach, 2003 Revision. World Health Organization; Geneva, Switzerland: 2004. [Accessed July 17, 2007]. 7-17-0007. Available at: http://www.who.int/hiv/pub/prev-care/en/arvrevision2003en.pdf.
-
- World Health Organization . Antiretroviral Therapy for HIV Infection in Adults and Adolescents: Recommendations for a Public Health Approach. 2006 Revision. World Health Organization; Geneva, Switzerland: 2006. [Accessed July 17, 2007]. 7-17-0007. Available at: http://www.who.int/hiv/pub/guidelines/artadultguidelines.pdf. - PubMed
Publication types
MeSH terms
Grants and funding
LinkOut - more resources
Full Text Sources
Medical
Research Materials
