

Patterns of polymorphism and demographic history in natural populations of Arabidopsis lyrata
- PMID: 18545707
- PMCID: PMC2408968
- DOI: 10.1371/journal.pone.0002411
Patterns of polymorphism and demographic history in natural populations of Arabidopsis lyrata
Erratum in
- PLoS One. 2010;5(8) doi: 10.1371/annotation/83559ebe-03be-4bf7-a1b8-b34b2903742a doi: 10.1371/annotation/83559ebe-03be-4bf7-a1b8-b34b2903742a
Abstract
Background: Many of the processes affecting genetic diversity act on local populations. However, studies of plant nucleotide diversity have largely ignored local sampling, making it difficult to infer the demographic history of populations and to assess the importance of local adaptation. Arabidopsis lyrata, a self-incompatible, perennial species with a circumpolar distribution, is an excellent model system in which to study the roles of demographic history and local adaptation in patterning genetic variation.
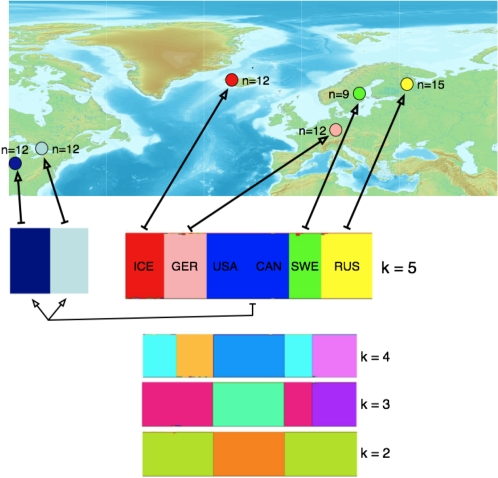
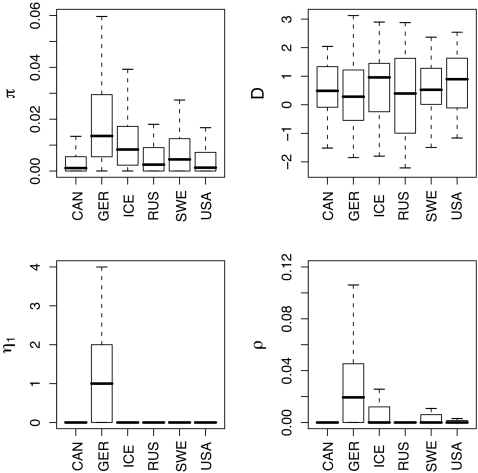
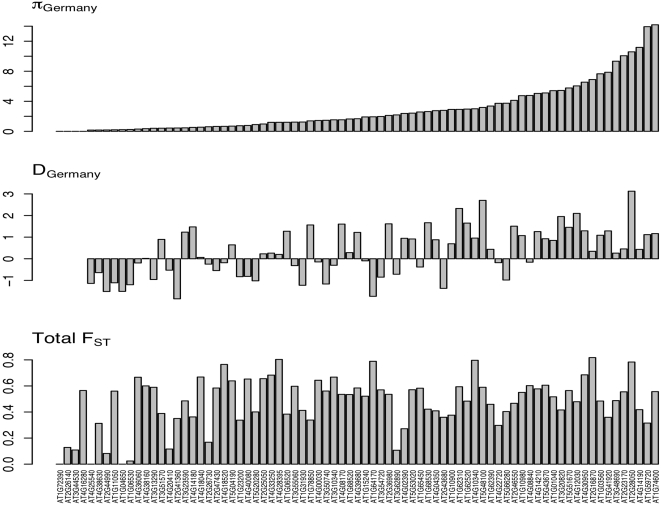
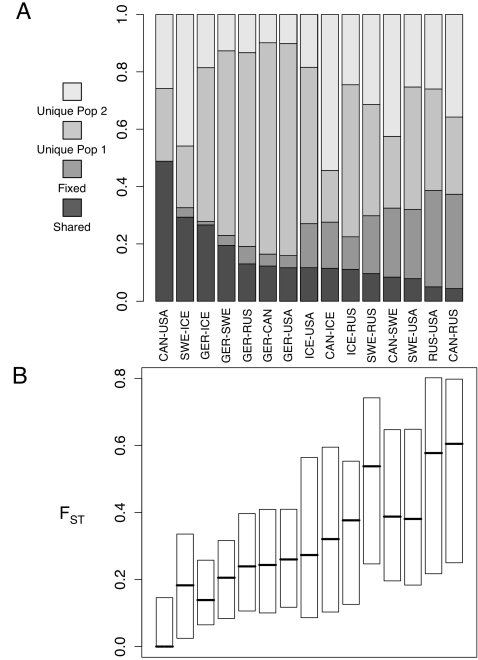
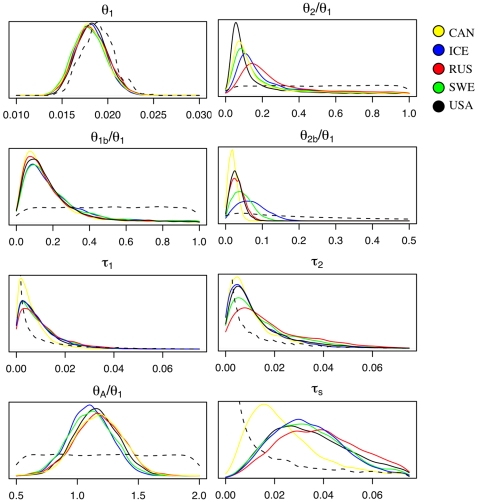
Principal findings: We studied nucleotide diversity in six natural populations of Arabidopsis lyrata, using 77 loci sampled from 140 chromosomes. The six populations were highly differentiated, with a median FST of 0.52, and structure analysis revealed no evidence of admixed individuals. Average within-population diversity varied among populations, with the highest diversity found in a German population; this population harbors 3-fold higher levels of silent diversity than worldwide samples of A. thaliana. All A. lyrata populations also yielded positive values of Tajima's D. We estimated a demographic model for these populations, finding evidence of population divergence over the past 19,000 to 47,000 years involving non-equilibrium demographic events that reduced the effective size of most populations. Finally, we used the inferred demographic model to perform an initial test for local adaptation and identified several genes, including the flowering time gene FCA and a disease resistance locus, as candidates for local adaptation events.
Conclusions: Our results underscore the importance of population-specific, non-equilibrium demographic processes in patterning diversity within A. lyrata. Moreover, our extensive dataset provides an important resource for future molecular population genetic studies of local adaptation in A. lyrata.
Conflict of interest statement
Figures
References
-
- Thornton KR, Jensen JD, Becquet C, Andolfatto P. Progress and prospects in mapping recent selection in the genome. Heredity. 2007;98:340–348. - PubMed
-
- Clark RM, Schweikert G, Toomajian C, Ossowski S, et al. Common sequence polymorphisms shaping genetic diversity in Arabidopsis thaliana. Science. 2007;317:338–342. - PubMed
-
- Wright SI, Bi IV, Schroeder SG, Yamasaki M, Doebley JF, et al. The effects of artificial selection on the maize genome. Science. 2005;308:1310–1314. - PubMed
Publication types
MeSH terms
Substances
Grants and funding
LinkOut - more resources
Full Text Sources
Other Literature Sources
Molecular Biology Databases
Miscellaneous
