. 2008 May;27(10):2575-86.
doi: 10.1111/j.1460-9568.2008.06226.x.

Quantal mEPSCs and residual glutamate: how horizontal cell responses are shaped at the photoreceptor ribbon synapse

Affiliations

Quantal mEPSCs and residual glutamate: how horizontal cell responses are shaped at the photoreceptor ribbon synapse

Lucia Cadetti et al. Eur J Neurosci. 2008 May.

Abstract

At the photoreceptor ribbon synapse, glutamate released from vesicles at different positions along the ribbon reaches the same postsynaptic receptors. Thus, vesicles may not exert entirely independent effects. We examined whether responses of salamander retinal horizontal cells evoked by light or direct depolarization during paired recordings could be predicted by summation of individual miniature excitatory postsynaptic currents (mEPSCs). For EPSCs evoked by depolarization of rods or cones, linear convolution of mEPSCs with photoreceptor release functions predicted EPSC waveforms and changes caused by inhibiting glutamate receptor desensitization. A low-affinity glutamate antagonist, kynurenic acid (KynA), preferentially reduced later components of rod-driven EPSCs, suggesting lower levels of glutamate are present during the later sustained component of the EPSC. A glutamate-scavenging enzyme, glutamic-pyruvic transaminase, did not inhibit mEPSCs or the initial component of rod-driven EPSCs, but reduced later components of the EPSC. Inhibiting glutamate uptake with a low concentration of DL-threo-beta-benzoyloxyaspartate (TBOA) also did not alter mEPSCs or the initial component of rod-driven EPSCs, but enhanced later components of the EPSC. Low concentrations of TBOA and KynA did not affect the kinetics of fast cone-driven EPSCs. Under both rod- and cone-dominated conditions, light-evoked currents (LECs) were enhanced considerably by TBOA. LECs were more strongly inhibited than EPSCs by KynA, suggesting the presence of lower glutamate levels. Collectively, these results indicate that the initial EPSC component can be largely predicted from a linear sum of individual mEPSCs, but with sustained release, residual amounts of glutamate from multiple vesicles pool together, influencing LECs and later components of EPSCs.


Figures
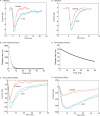
Fig. 1
Fig. 1
Convolution of miniature excitatory postsynaptic currents (mEPSCs) with empirically derived photoreceptor release functions approximated the waveforms of actual EPSCs, even after broadening the mEPSC waveform by blocking glutamate receptor desensitization with cyclothiazide (CTZ). (A) Averaged mEPSCs from a horizontal cell during paired recording with a cone. mEPSCs were obtained in control conditions (red trace) and after application of CTZ (0.1 mm; blue trace), aligned at the half-maximal points of their rising phases, and fit with a three-exponential function as described in Materials and methods. (B) Cone release function derived from earlier measurements of exocytotic capacitance changes evoked by test pulses of varying duration (Rabl et al., 2005). For purposes of illustration, the instantaneous release function was scaled by 57 aF/vesicle. However, the convolution was scaled to minimize the sum of the square differences between the actual and predicted responses. (C) EPSCs evoked in the horizontal cell by depolarizing test steps applied to a cone in control conditions (red) and after 2 min application of CTZ (blue). Overlaid on these traces are the waveforms predicted by convolution of the mEPSCs shown in (A), with the cone release function shown in (B) (smooth trace). The waveform predicted by convolution was scaled to minimize the sum of the square differences between actual and predicted responses. (D) Average mEPSCs from a different horizontal cell obtained during paired recording with a rod, obtained in control (red trace) and CTZ (blue) conditions. (E) Rod release function. (F) Convolution of average mEPSCs in (D) with the release function (smooth trace) overlaid on actual EPSCs evoked by depolarizing steps applied to a simultaneously recorded rod in both control (red) and CTZ (blue) conditions.
Fig. 2
Fig. 2
Effects of low- and high-affinity antagonists, kynurenic acid (KynA) and 2,3-dihydroxy-6-nitro-7-sulfamoylbenzo(f)quinoxaline (NBQX), on rod-driven excitatory postsynaptic currents (EPSCs) and miniature (m)EPSCs in horizontal cells. (A) EPSCs evoked in a horizontal cell by depolarizing steps from –70 to –10 mV applied to a simultaneously recorded rod. Control: black trace. KynA: gray trace. Wash: light gray trace. (B) Control and KynA traces rescaled to match their peak amplitudes. (C) Average mEPSCs recorded from the same horizontal cell in control conditions (black trace) and after application of KynA (dark gray trace, 0.25 mm). (D) EPSCs evoked in a horizontal cell by depolarizing steps from –70 to –10 mV applied to a simultaneously recorded rod. Control: black trace. NBQX: gray trace. Wash: light gray trace. (E) Control and NBQX traces rescaled to match their peak amplitudes. (F) Average mEPSCs recorded from the same horizontal cell in control conditions (black trace) and after application of NBQX (gray trace, 0.1 μm).
Fig. 3
Fig. 3
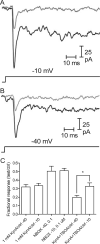
The initial peak amplitudes of large and small EPSCs were inhibited similarly by kynurenic acid (KynA). EPSCs were evoked in a horizontal cell by depolarizing steps from –70 to –10 mV (A) and –40 mV (B) applied to a simultaneously recorded rod. Both the large (A) and small (B) EPSCs were inhibited to a similar degree by KynA (1 mm). (C) For the bar graph in (C), the amplitudes of test responses were divided by control responses to show the average changes in the peak amplitude of EPSCs evoked by test steps to –10 and –40 mV that were produced by KynA (1 mm; n = 14), 2,3-dihydroxy-6-nitro-7-sulfamoylbenzo(f)quinoxaline (NBQX; 0.1 μm; step to –10 mV, n = 10; step to –40 mV, n = 4), and a combination of KynA (1 mm) and dl-threo-β-benzoyloxyaspartate (TBOA; 0.1 mm). There was no significant difference in the inhibition of large and small EPSCs by KynA or NBQX, but smaller EPSCs evoked by steps to –40 mV were inhibited significantly more than large EPSCs evoked by steps to –10 mV by KynA when applied in the presence of the glutamate uptake inhibitor, TBOA (P = 0.01, paired t-test, n = 9). *P < 0.01.
Fig. 4
Fig. 4
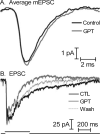
The glutamate scavenging enzyme, glutamic-pyruvic transaminase (GPT; 10 U/mL), had little effect on miniature excitatory postsynaptic currents (mEPSCs) but preferentially inhibited slower components of rod-driven EPSCs. GPT was applied in the presence of pyruvate (2 mm). (A) Average mEPSCs obtained in control conditions (black trace) and after application of GPT (gray trace). (B) EPSCs evoked in the same horizontal cell by depolarizing steps from –70 to –10 mV applied to a presynaptic rod. Control: black trace. GPT: dark gray trace. Wash: light gray trace. The outward shift in baseline current produced by GPT was compensated so as to compare the traces more easily.
Fig. 5
Fig. 5
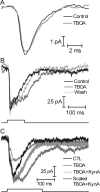
The glutamate uptake inhibitor, dl-threo-β-benzoyloxyaspartate (TBOA; 10 μm), had little effect on mEPSCs, but nonetheless broadened rod-driven EPSCs. (A) Average mEPSCs obtained before (black trace) and after application of TBOA (gray trace). (B) EPSCs evoked in the same horizontal cell by 60-mV steps from –70 to –10 mV applied to a presynaptic rod. Control: black trace. TBOA: gray trace. Wash: light gray trace. (C) TBOA broadened rod-driven EPSCs recorded from a different horizontal cell. Kynurenic acid (KynA; 0.25 mm) inhibited and accelerated decay of the EPSC. The preferential inhibition by KynA of later parts of the EPSC is more evident after rescaling the trace to match the amplitude of the trace obtained in TBOA prior to KynA application. By accelerating response decay, KynA restored the kinetics of the EPSC closer to those of the control response. Baseline current shifts produced by TBOA and KynA were removed from (B) and (C) to compare the traces more easily.
Fig. 6
Fig. 6
Effects of kynurenic acid (KynA; 0.1 mm) and dl-threo-β-benzoyloxyaspartate (TBOA; 10 μm) on cone-driven EPSCs. (A) Inhibition by KynA of EPSCs evoked by depolarizing steps from –70 to –10 mV applied to a simultaneously recorded cone. Control: black trace. KynA: dark gray trace. (B) To compare waveforms more easily, the trace obtained in KynA was rescaled (light gray trace) to match the amplitude of the control trace. (C) The inhibition by KynA of EPSCs evoked in the same cell by steps to –30 mV was similar to the inhibition of larger EPSCs evoked by steps to –10 mV (A). (D) TBOA (10 μm) had little effect on cone-driven EPSCs. Control: black trace. TBOA: gray trace. The inward shift in baseline current produced by TBOA was compensated to better compare the traces.
Fig. 7
Fig. 7
Kynurenic acid (KynA) inhibited horizontal cell light-evoked currents (LECs) more strongly than EPSCs. (A) Rod-dominated LECs evoked by a saturating 1-s, 580-nm light flash applied in scotopic conditions. KynA (dark gray trace) reversibly inhibited the LEC. (B) Cone-dominated LECs evoked by a bright 1-s, 680-nm light flash applied in the presence of a 480-nm adapting background. KynA (dark gray trace) also reversibly inhibited the cone-dominated LEC. (C) Inhibition by KynA (0.25 mm) and 2,3-dihydroxy-6-nitro-7-sulfamoylbenzo(f)quinoxaline (NBQX; 0.1 μμ) of EPSCs recorded from rod–horizontal cell pairs and LECs recorded from horizontal cells under rod-dominated conditions (580 nm light applied to dark-adapted retina). KynA inhibited rod-dominated LECs (n = 7) significantly more than it inhibited EPSCs evoked by depolarizing steps applied to –10 mV (n = 10; P < 0.0001) or –40 mV (n = 9; P = 0.0017; not shown). NBQX inhibited LECs (n = 7) and EPSCs evoked by depolarizing steps applied to –10 mV (n = 10) or –40 mV (n = 4; data shown in Fig. 3) equally well. (D) Inhibition by KynA (0.1 mm) and NBQX (0.1 μm) of EPSCs recorded from cone–horizontal cell pairs and LECs recorded from horizontal cells under cone-dominated conditions (680 nm light applied to light-adapted retina). Like rod-driven synapses, KynA inhibited cone-dominated LECs (n = 5) significantly more than it inhibited EPSCs evoked by depolarizing steps applied to –10 mV (n = 11; P = 0.0013) or –30 mV (n = 6; P = 0.0011; not shown). NBQX inhibited LECs (n = 7) and EPSCs evoked by depolarizing steps applied to –10 mV (n = 8) or –40 mV (n = 8; not shown) equally well. The data in (C) and (D) are plotted as fractional response, wherein the LECs or EPSCs recorded in KynA or NBQX were divided by the amplitude of responses obtained in control conditions. *P < 0.01.
Fig. 8
Fig. 8
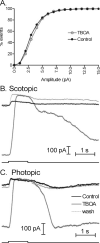
dl-threo-β-benzoyloxyaspartate (TBOA; 10 μm) enhanced LECs but not mEPSCs. (A) Cumulative amplitude histogram of mEPSCs obtained in control conditions (filled circles; n = 426 events) and after application of TBOA (open circles, n = 419). (B) Rod-dominated LECs evoked by a bright green light flash applied with an LED in scotopic conditions. TBOA (dark gray trace) reversibly enhanced the LEC. Control: black trace. Wash: light gray trace. (C) Cone-dominated LECs evoked by a bright red light flash from an LED applied in the presence of a 480-nm adapting background. TBOA (dark gray trace) also reversibly enhanced the cone-dominated LEC. Same cell in all three panels.

References

    1. Ashmore JF, Copenhagen DR. An analysis of transmission from cones to hyperpolarizing bipolar cells in the retina of the turtle. J. Physiol. (Lond.) 1983;340:569–597. - PMC - PubMed
    1. Auger C, Marty A. Quantal currents at single-site central synapses. J. Physiol. (Lond.) 2000;526:3–11. - PMC - PubMed
    1. Barbour B, Keller BU, Llano I, Marty A. Prolonged presence of glutamate during excitatory synaptic transmission to cerebellar Purkinje cells. Neuron. 1994;12:1331–1343. - PubMed
    1. Berntson A, Taylor WR. The unitary event amplitude of mouse retinal on-cone bipolar cells. Vis. Neurosci. 2003;20:621–626. - PubMed
    1. Burris C, Klug K, Ngo IT, Sterling P, Schein S. How Muller glial cells in macaque fovea coat and isolate the synaptic terminals of cone photoreceptors. J. Comp. Neurol. 2002;453:100–111. - PubMed

Publication types

MeSH terms