. 2008 Aug;69(3):603-20.
doi: 10.1111/j.1365-2958.2008.06301.x. Epub 2008 Jun 28.

Candida glabrata environmental stress response involves Saccharomyces cerevisiae Msn2/4 orthologous transcription factors

Affiliations

Candida glabrata environmental stress response involves Saccharomyces cerevisiae Msn2/4 orthologous transcription factors

Andreas Roetzer et al. Mol Microbiol. 2008 Aug.

Abstract

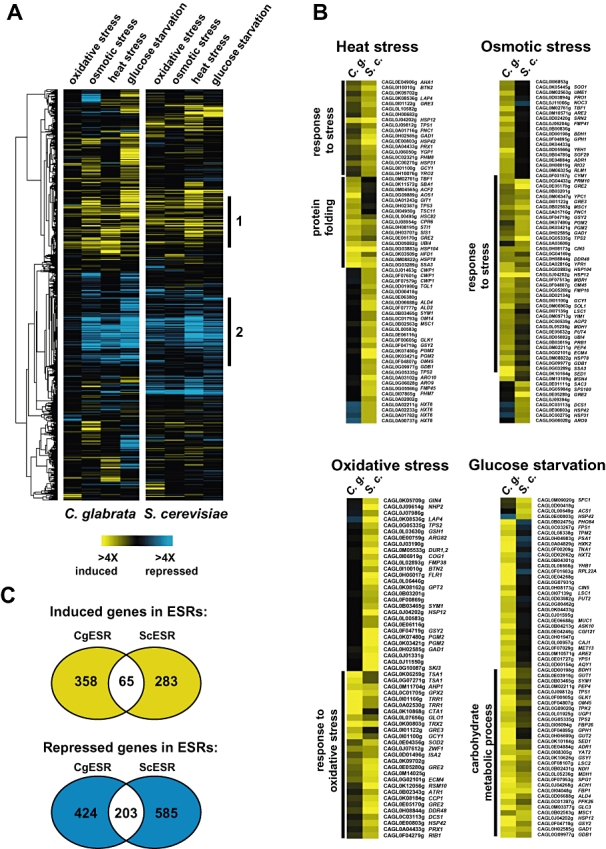
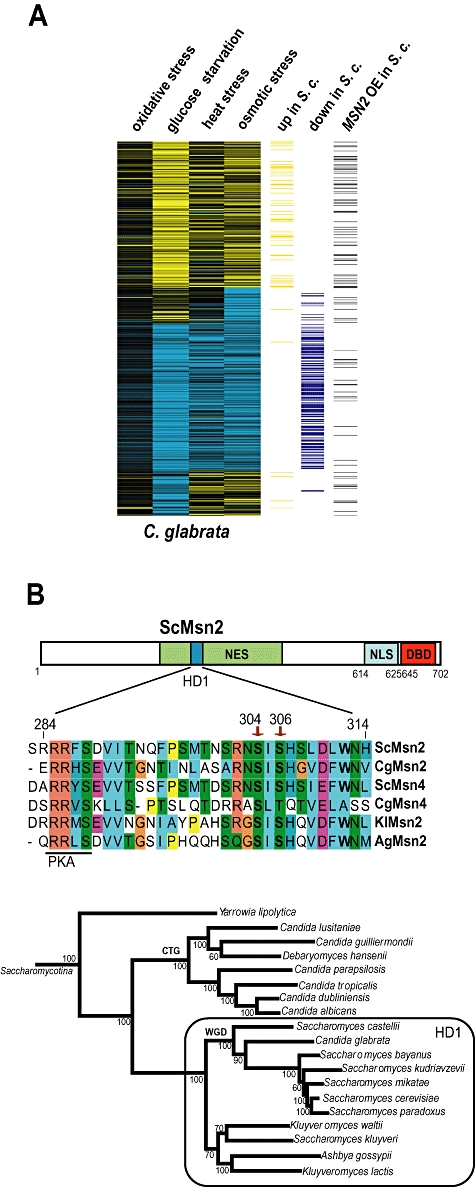
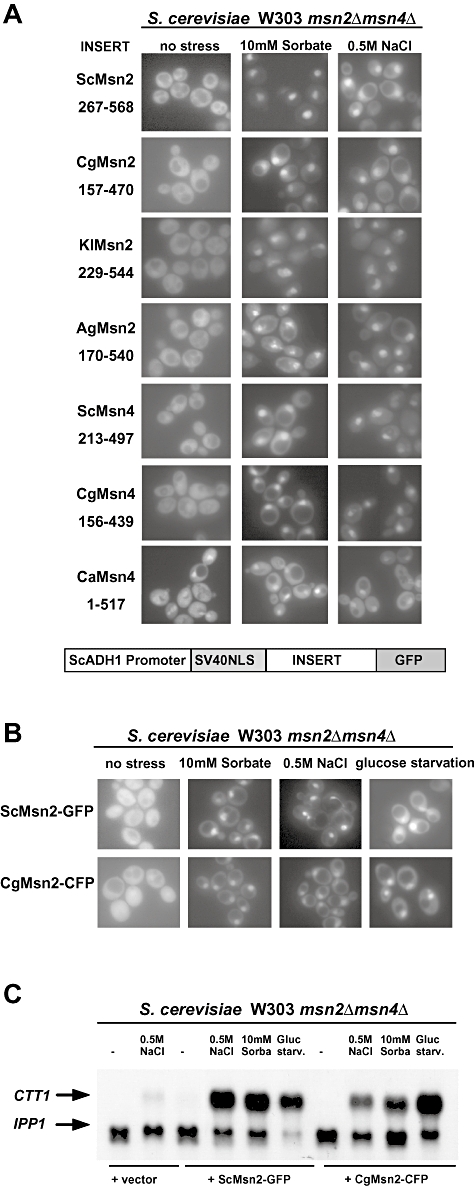
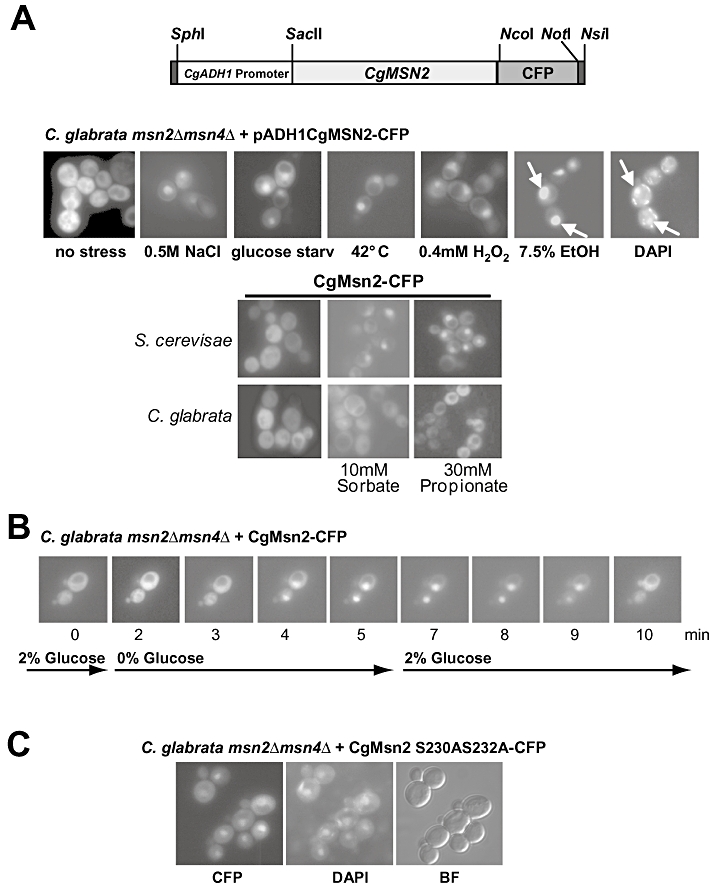
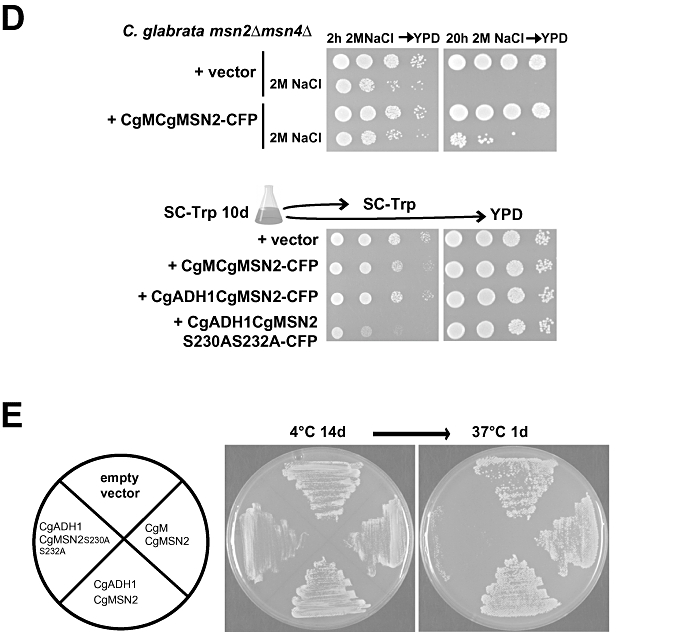
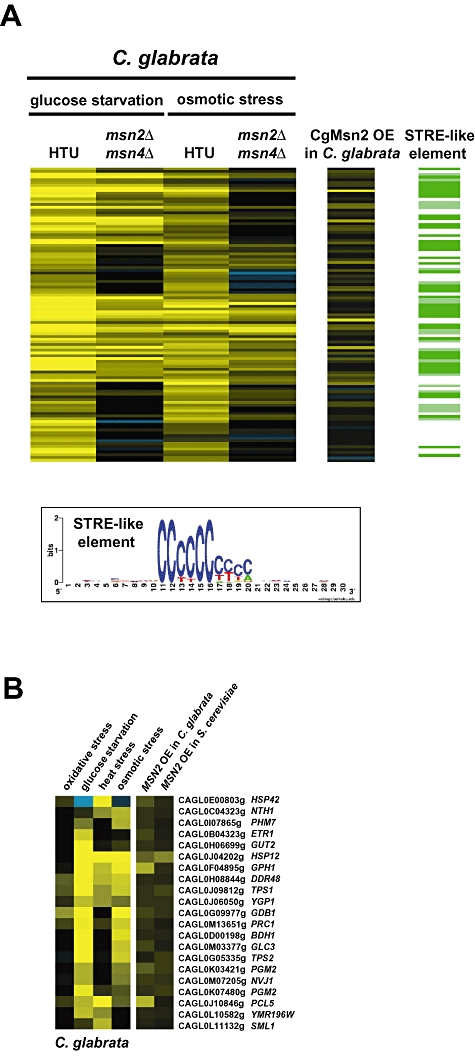
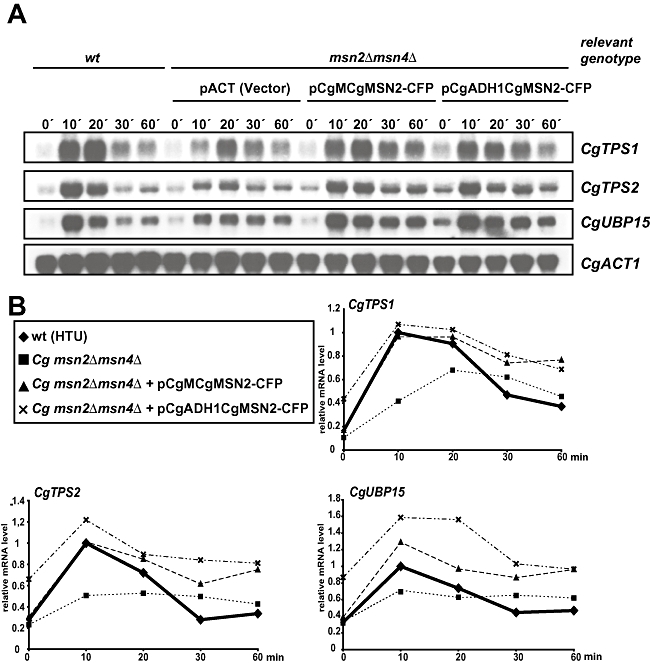
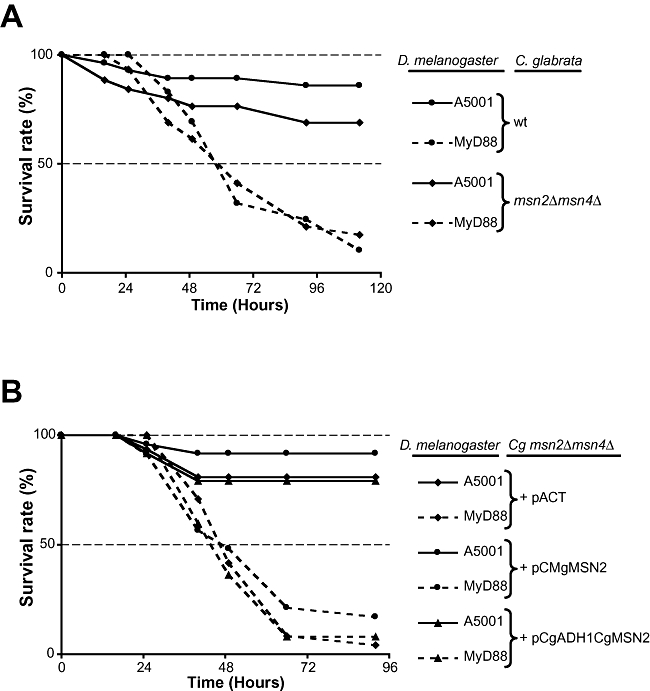
We determined the genome-wide environmental stress response (ESR) expression profile of Candida glabrata, a human pathogen related to Saccharomyces cerevisiae. Despite different habitats, C. glabrata, S. cerevisiae, Schizosaccharomyces pombe and Candida albicans have a qualitatively similar ESR. We investigate the function of the C. glabrata syntenic orthologues to the ESR transcription factor Msn2. The C. glabrata orthologues CgMsn2 and CgMsn4 contain a motif previously referred to as HD1 (homology domain 1) also present in Msn2 orthologues from fungi closely related to S. cerevisiae. We show that regions including this motif confer stress-regulated intracellular localization when expressed in S. cerevisiae. Site-directed mutagenesis confirms that nuclear export of CgMsn2 in C. glabrata requires an intact HD1. Transcript profiles of CgMsn2/4 mutants and CgMsn2 overexpression strains show that they regulate a part of the CgESR. CgMsn2 complements a S. cerevisiae msn2 null mutant and in stressed C. glabrata cells, rapidly translocates from the cytosol to the nucleus. CgMsn2 is required for full resistance against severe osmotic stress and rapid and full induction of trehalose synthesis genes (TPS1, TPS2). Constitutive activation of CgMsn2 is detrimental for C. glabrata. These results establish an Msn2-regulated general stress response in C. glabrata.


Figures

Fig. 1
Fig. 1
Comparison of genome-wide expression levels in response to environmental changes in C. glabrata and S. cerevisiae. A. Hierarchical clustering. Transcript profiles were determined by hybridization to genome-wide C. glabrata microarrays. The sets represent average inductions of replicate profiles of C. glabrata wild-type strain (4166 ORFs) after treatment with 0.4 mM H2O2, upon glucose starvation, heat shock by incubation at 42°C and hyperosmolarity stress treatment with 0.5 M NaCl (left panel). All treatments were done at 30°C for 20 min. The developed profile was compared with corresponding S. cerevisiae expression data (Gasch et al., 2000) (right panel). Major clusters are labelled corresponding to induced and to repressed genes (labelled as 1 and 2), in both C. glabrata and S. cerevisiae. B. Genes involved in four different stress responses were clustered after specific selection (heat stress > 11-fold, osmotic stress > sixfold, oxidative stress > sixfold and glucose starvation > 10-fold). Identified clusters in both C. glabrata and S. cerevisiae are indicated. Gene names correspond to C. glabrata systematic ORF designations and their corresponding S. cerevisiae orthologues. C. The overlap between the CgESR and ScESR patterns is depicted as Venn diagram. CgESR was defined as described in Fig. 2A, with genes induced or repressed at least in one tested condition; ScESR data are from Gasch et al. (2000).
Fig. 2
Fig. 2
CgESR is similar to ScESR and includes many Msn2-regulated genes. A. The CgESR shown here includes 760 genes selected by being induced or repressed significantly (fourfold) in one of the tested conditions. Columns 5 (up in S.c.) and 6 (down in S.c.) show the corresponding ScESR genes from S. cerevisiae. Column 7 (MSN2 OE in S.c.) displays induction of the orthologous S. cerevisiae genes by MSN2 overexpression (Chua et al., 2006). B. Alignment of Msn2 orthologous sequences including the HD1. The shared core motif corresponds to positions 284–314 of ScMsn2. The HD1 signature was detected only in close relatives of S. cerevisiae, circled in the phylogeny (taken from Fitzpatrick et al., 2006). The sequences used in the alignment are: S. cerevisiae (YMR037C, ScMsn2; YKL062W, ScMsn4), A. gossypii (ABR089C, AgMsn2), C. glabrata (CAGL0F05995g, CgMsn2; CAGL0M13189g, CgMsn4) and K. lactis (KLLA0F26961g, KlMsn2).
Fig. 3
Fig. 3
Regulated localization control is functionally conserved in Msn2-like factors. A. Indicated regions of Msn2 and Msn4 orthologues were fused to GFP and a SV40-NLS. GFP fusion plasmids were expressed in S. cerevisiae strain W303-1A msn2Δ msn4Δ. Localization of GFP fusions was determined by fluorescence microscopy in unstressed cells and 10 min after exposure to weak acid stress (10 mM sorbic acid) and osmotic stress (0.5 M NaCl). B. S. cerevisiae W303-1A msn2Δ msn4Δ strains containing plasmids expressing either CgMsn2–CFP or ScMsn2–GFP driven by the ScADH1 promoter (pAMG, pACgMC) were grown to exponential phase and exposed to conditions as indicated. Localization was recorded after 10 min by fluorescence microscopy of living cells. C. mRNA levels of the Msn2-regulated gene CTT1 and the control IPP1 were visualized on Northern blots after 20 min stress treatment.
Fig. 4
Fig. 4
C. glabrata CgMsn2 nuclear localization is stress-regulated. A. The CgADH1-CgMsn2–CFP construct is illustrated schematically and the positions of used restrictions sites are indicated. Localization of CgMsn2–CFP in the C. glabrata strain Cg msn2Δmsn4Δ was determined by fluorescence microscopy. CFP fluorescence was recorded in exponentially growing cells approximately 10 min after exposure to the indicated stress conditions. Nuclei were stained by addition of 2 μg ml−1 4,6 diamidino-2-phenylindol (DAPI) dye to the cultures 10 min prior to microscopy. In living cells, nucleic acids, such as the mitochondrial DNA, are also stained by DAPI, resulting in background staining. CgMsn2 localization during weak acid stress. CgMsn2–CFP accumulates in S. cerevisiae in the nucleus during weak acid stress (10 mM sorbic acid, 30 mM propionic acid). CgMsn2–CFP does not accumulate in the nucleus in C. glabrata. Arrows indicate stained nuclear DNA. B. Nucleocytoplasmic shuttling of CgMsn2–CFP during glucose starvation and re-feeding. Localization of CgMsn2–CFP was visualized by fluorescence microscopy of C. glabrata cells fixed to a coverslip with Concanavalin A and localization of the CFP fusion was visualized by fluorescence microscopy. C. Localization of CgMsn2 S230AS232A–CFP in unstressed cells. Cg msn2Δmsn4Δ cells expressing CgMsn2 S230AS232A–CFP were grown in rich media to early logarithmic phase and localization of the CFP fusion protein was determined by fluorescence microscopy. D. Viability of Cg msn2Δmsn4Δ mutant cells expressing Msn2 variants. Cultures of Cg msn2Δmsn4Δ transformed with the empty vector as a control, or with a plasmid expressing CgMSN2 under the control of the native promoter, were incubated in selective media containing 2 M NaCl for 2 and 20 h. Cell suspensions were spotted in 10-fold dilutions on YPD plates and incubated at 37°C over night. Cultures of Cg msn2Δmsn4Δ transformed with the empty vector, or with plasmids expressing CgMSN2 under the control of the native or CgADH1 promoter, or expressing CgMSN2 S230AS232A–CFP, were grown in selective media at 30°C for 10 days. Cells were then spotted in 10-fold dilutions on YPD and SC-Trp plates incubated at 37°C over night and growth recorded. E. High expression of CgMsn2 S230AS232A confers cold sensitivity. Replica-plated patches of Cg msn2Δmsn4Δ transformed with the above vectors were grown on selective plates overnight at 37°C, plates were kept at 4°C and room temperature as a control for 14 days. Plates were replica-plated to fresh and incubated at 37°C over night and growth recorded. Viability was also tested by colony-forming assay showing a threefold reduced colony-forming ability (0.38 of wild type; SD = 0.12; P = 0.05).
Fig. 4
Fig. 4
C. glabrata CgMsn2 nuclear localization is stress-regulated. A. The CgADH1-CgMsn2–CFP construct is illustrated schematically and the positions of used restrictions sites are indicated. Localization of CgMsn2–CFP in the C. glabrata strain Cg msn2Δmsn4Δ was determined by fluorescence microscopy. CFP fluorescence was recorded in exponentially growing cells approximately 10 min after exposure to the indicated stress conditions. Nuclei were stained by addition of 2 μg ml−1 4,6 diamidino-2-phenylindol (DAPI) dye to the cultures 10 min prior to microscopy. In living cells, nucleic acids, such as the mitochondrial DNA, are also stained by DAPI, resulting in background staining. CgMsn2 localization during weak acid stress. CgMsn2–CFP accumulates in S. cerevisiae in the nucleus during weak acid stress (10 mM sorbic acid, 30 mM propionic acid). CgMsn2–CFP does not accumulate in the nucleus in C. glabrata. Arrows indicate stained nuclear DNA. B. Nucleocytoplasmic shuttling of CgMsn2–CFP during glucose starvation and re-feeding. Localization of CgMsn2–CFP was visualized by fluorescence microscopy of C. glabrata cells fixed to a coverslip with Concanavalin A and localization of the CFP fusion was visualized by fluorescence microscopy. C. Localization of CgMsn2 S230AS232A–CFP in unstressed cells. Cg msn2Δmsn4Δ cells expressing CgMsn2 S230AS232A–CFP were grown in rich media to early logarithmic phase and localization of the CFP fusion protein was determined by fluorescence microscopy. D. Viability of Cg msn2Δmsn4Δ mutant cells expressing Msn2 variants. Cultures of Cg msn2Δmsn4Δ transformed with the empty vector as a control, or with a plasmid expressing CgMSN2 under the control of the native promoter, were incubated in selective media containing 2 M NaCl for 2 and 20 h. Cell suspensions were spotted in 10-fold dilutions on YPD plates and incubated at 37°C over night. Cultures of Cg msn2Δmsn4Δ transformed with the empty vector, or with plasmids expressing CgMSN2 under the control of the native or CgADH1 promoter, or expressing CgMSN2 S230AS232A–CFP, were grown in selective media at 30°C for 10 days. Cells were then spotted in 10-fold dilutions on YPD and SC-Trp plates incubated at 37°C over night and growth recorded. E. High expression of CgMsn2 S230AS232A confers cold sensitivity. Replica-plated patches of Cg msn2Δmsn4Δ transformed with the above vectors were grown on selective plates overnight at 37°C, plates were kept at 4°C and room temperature as a control for 14 days. Plates were replica-plated to fresh and incubated at 37°C over night and growth recorded. Viability was also tested by colony-forming assay showing a threefold reduced colony-forming ability (0.38 of wild type; SD = 0.12; P = 0.05).
Fig. 5
Fig. 5
Determination of genes dependent on CgMsn2/CgMsn4. A. Wild type and Cg msn2Δmsn4Δ cells were exposed to osmotic stress (0.5 M NaCl) and glucose depletion and transcript profiles determined by hybridization to genome-wide C. glabrata microarrays. Hierarchical clustering of genes with a wild type to Cg msn2Δmsn4Δ ratio > 1.5 is shown. The right panel shows the transcript profile of the CgADH1 promoter-driven overexpression (OE) of CgMsn2–CFP compared with CgMSN2 native promoter-driven CgMsn2–CFP expression. Logo representation of a STRE-like sequence pattern found by AlignAce among the CgMsn2-regulated genes (indicated on the right). B. C. glabrata and S. cerevisiae have orthologous Msn2 target genes. A core set of 21 CgESR genes is induced by overexpression of CgMSN2 in C. glabrata and ScMSN2 in S. cerevisiae.
Fig. 6
Fig. 6
CgMsn2 is required for rapid induction of transcription after osmotic stress. A. Northern blot analysis of CgTPS1, CgTPS2 and CgUBP15 transcripts during 0.5 M NaCl induced osmotic stress. C. glabrata wild type, Cg msn2Δmsn4Δ and Cg msn2Δmsn4Δ transformed with pCgMCgMsn2–CFP or pCgADH1CgMsn2–CFP were grown to exponential phase before 0.5 M NaCl was added. Samples for RNA extraction were taken at indicated time points. mRNA levels were visualized by hybridization of radio-labelled probes and autoradiography. CgACT1 mRNA was used as loading control. B. Quantification of mRNA levels of CgTPS1, CgTPS2 and CgUBP15 normalized to CgACT1 and expressed relative to the highest wild-type level.
Fig. 7
Fig. 7
Survival of D. melanogaster to wild type or msn2Δmsn4Δ mutant C. glabrata infection. A. Flies were injected with 7500 C. glabrata cells. MyD88 mutant flies succumbed rapidly to a challenge with either wild-type C. glabrata or Cg msn2Δmsn4Δ mutant strain. The genotypes of the infected flies are indicated (A5001: wild-type). B. Immunosuppressed flies succumb rapidly when challenged with Cg msn2Δmsn4Δ transformed with either the empty pACT plasmid or plasmids expressing CgMsn2 (pCgMCgMSN2 or pCgADH1CgMSN2). Survival was monitored at 29°C. The survival rate is expressed as a percentage. These survival experiments are representative of at least three independent experiments for each panel. The slight difference observed between wild-type flies injected with wild-type or mutant yeasts is not reproducible. Similar results were observed with a lower dose of injected C. glabrata (5000).

References

    1. Alonso-Monge R, Navarro-Garcia F, Molero G, Diez-Orejas R, Gustin M, Pla J, et al. Role of the mitogen-activated protein kinase Hog1p in morphogenesis and virulence of Candida albicans. J Bacteriol. 1999;181:3058–3068. - PMC - PubMed
    1. Beck T, Hall MN. The TOR signalling pathway controls nuclear localization of nutrient-regulated transcription factors. Nature. 1999;402:689–692. - PubMed
    1. Bilaud T, Koering CE, Binet-Brasselet E, Ancelin K, Pollice A, Gasser SM, Gilson E. The telobox, a Myb-related telomeric DNA binding motif found in proteins from yeast, plants and human. Nucleic Acids Res. 1996;24:1294–1303. - PMC - PubMed
    1. Bilsland E, Molin C, Swaminathan S, Ramne A, Sunnerhagen P. Rck1 and Rck2 MAPKAP kinases and the HOG pathway are required for oxidative stress resistance. Mol Microbiol. 2004;53:1743–1756. - PubMed
    1. Boorsma A, Foat BC, Vis D, Klis F, Bussemaker HJ. T-profiler: scoring the activity of predefined groups of genes using gene expression data. Nucleic Acids Res. 2005;33:W592–W595. - PMC - PubMed

Publication types

MeSH terms