. 2008 Jun;16(6):885-96.
doi: 10.1016/j.str.2008.03.009.

Mapping the nucleotide and isoform-dependent structural and dynamical features of Ras proteins

Affiliations

Mapping the nucleotide and isoform-dependent structural and dynamical features of Ras proteins

Alemayehu A Gorfe et al. Structure. 2008 Jun.

Abstract

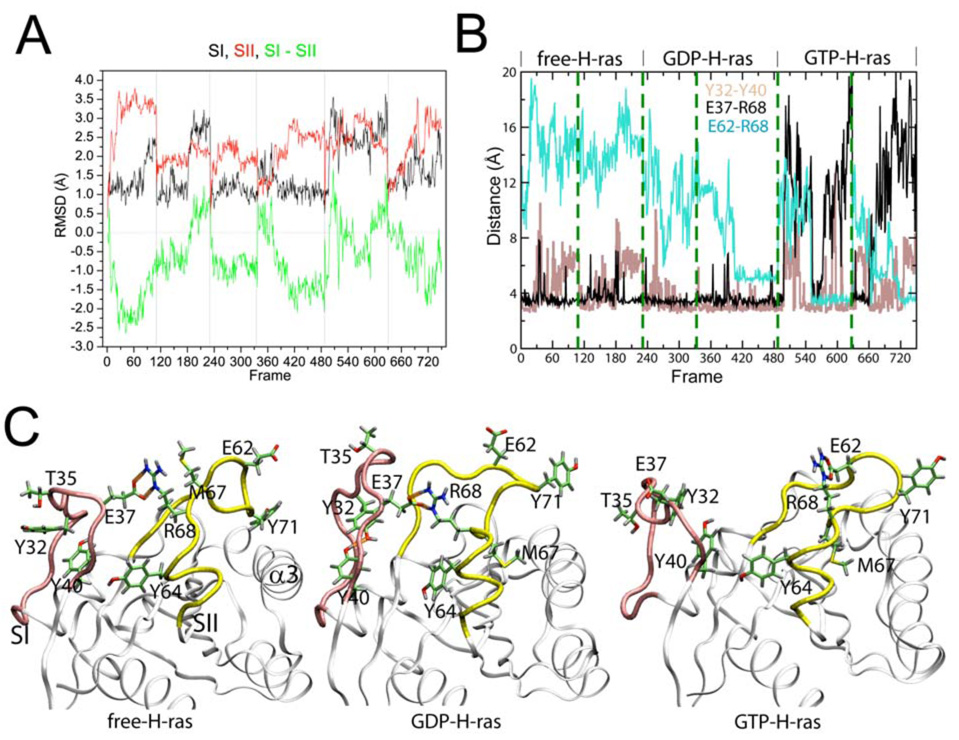
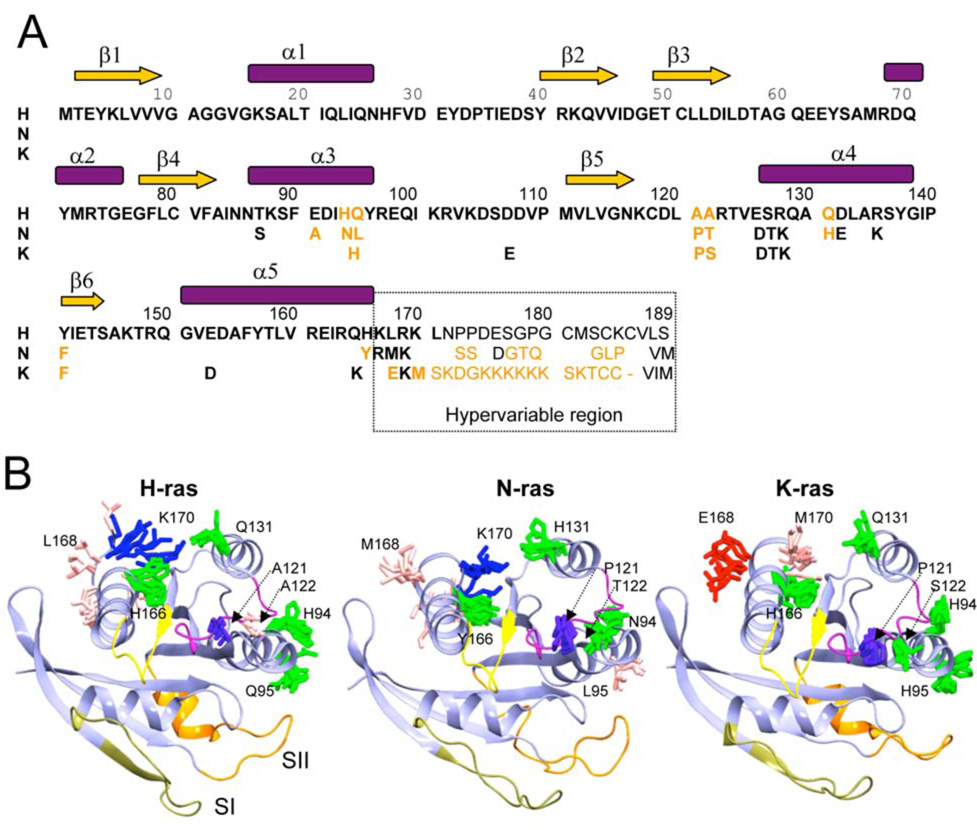
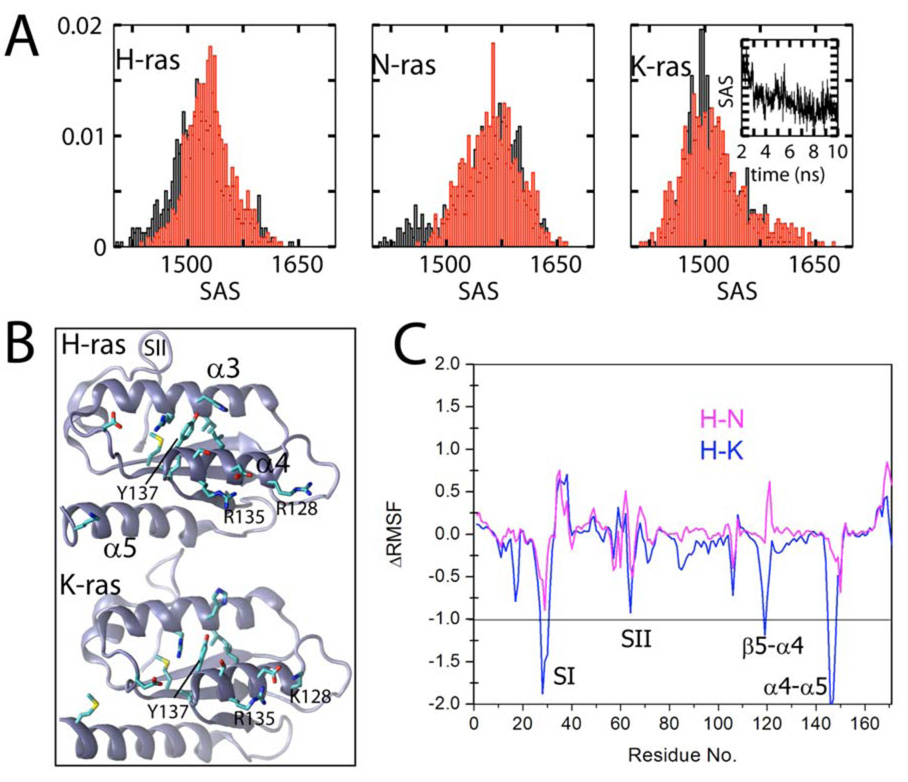
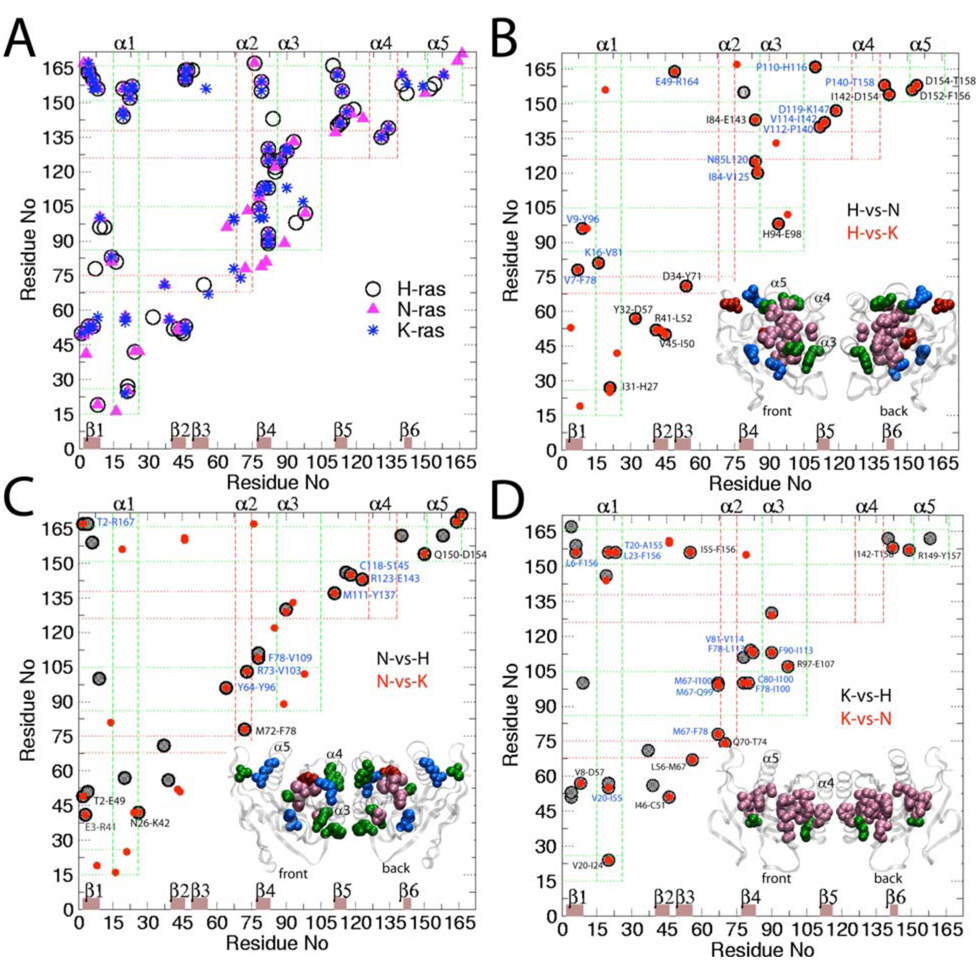
Ras GTPases are conformational switches controlling cell proliferation, differentiation, and development. Despite their prominent role in many forms of cancer, the mechanism of conformational transition between inactive GDP-bound and active GTP-bound states remains unclear. Here we describe a detailed analysis of available experimental structures and molecular dynamics simulations to quantitatively assess the structural and dynamical features of active and inactive states and their interconversion. We demonstrate that GTP-bound and nucleotide-free G12V H-ras sample a wide region of conformational space, and show that the inactive-to-active transition is a multiphase process defined by the relative rearrangement of the two switches and the orientation of Tyr32. We also modeled and simulated N- and K-ras proteins and found that K-ras is more flexible than N- and H-ras. We identified a number of isoform-specific, long-range side chain interactions that define unique pathways of communication between the nucleotide binding site and the C terminus.


Figures

Figure 1
Figure 1
Results of PCA on the Ras catalytic domain. (a), Conformer plot: Projection of all Ras X-ray structures onto the principal planes defined by the two most significant principal components (termed PC1 and PC2). Structures are colored by nucleotide state, triphosphate in red and diphosphate in green (see table S1 for further details) and labelled with their PDB code where space permits. Dashed ovals represent the grouping obtained from hierarchical clustering of the projected structures in the PC1 to PC3 planes detailed in figure 1b. Insert: eigenvalue spectrum detailing results obtained from diagonalization of the atomic displacement correlation matrix of Cα atom coordinates. The magnitude of each eigen value is expressed as the percentage of the total variance (mean-square fluctuation) captured by the corresponding eigenvector. Labels beside each point indicate the cumulative sum of the total variance accounted for in all preceding eigenvectors. (b), Heat map clustering of Ras structures in the PC1 to PC3 planes. Structure labels are colored by nucleotide state (see table S1 for further details).
Figure 1
Figure 1
Results of PCA on the Ras catalytic domain. (a), Conformer plot: Projection of all Ras X-ray structures onto the principal planes defined by the two most significant principal components (termed PC1 and PC2). Structures are colored by nucleotide state, triphosphate in red and diphosphate in green (see table S1 for further details) and labelled with their PDB code where space permits. Dashed ovals represent the grouping obtained from hierarchical clustering of the projected structures in the PC1 to PC3 planes detailed in figure 1b. Insert: eigenvalue spectrum detailing results obtained from diagonalization of the atomic displacement correlation matrix of Cα atom coordinates. The magnitude of each eigen value is expressed as the percentage of the total variance (mean-square fluctuation) captured by the corresponding eigenvector. Labels beside each point indicate the cumulative sum of the total variance accounted for in all preceding eigenvectors. (b), Heat map clustering of Ras structures in the PC1 to PC3 planes. Structure labels are colored by nucleotide state (see table S1 for further details).
Figure 2
Figure 2
Results of PCA on the Ras catalytic domain. (a–c), The contribution of each residue to the first three principal components. (d), Back view of the Ras catalytic domain, with the first principal component represented as equidistant atomic displacements from the mean structure. Displacements are scaled by the standard deviation of the distribution along the first principal component.
Figure 3
Figure 3
Analysis of structures from MD simulations of H-ras-G12V. (a–c), Projection of snapshots sampled every 100ps from GDP-H-ras (a), GTP-H-ras (b), and free-H-ras (c) onto the first two principal components defined by the x-ray structures (black circles, see Fig. 1). (d), Change in root mean square fluctuations (ΔRMSF in Å) of GTP-H-ras (black) and free-H-ras (red) form GDP-H-ras. In this and subsequent figures, data are obtained from two concatenated runs that differ in the assignment of initial velocities.
Figure 4
Figure 4
Structure and dynamics of switch regions SI and SII. (a), Root mean square deviation (RMSD) for SI (black) and SII (red), and the difference between RMSDs of SI and SII (SI–SII, green). (b), Evolution of distances between selected side chain atoms at SI and SII: Tyr32Oη-Tyr40Oη(SI), Glu62Cδ-Arg68Nε (SII), and (Glu37Cδ-Arg68Nη2) (inter-switch). Vertical dashed lines demarcate the range of 100ps-separated frames from simulations free-H-ras (first two columns from left), GDP-H-ras (middle two) and GTP-H-ras (last two). (c), Snapshots illustrating the configurations of SI (pink) and SII (yellow) together with key side chains (sticks) that undergo major reorientation upon nucleotide exchange.
Figure 5
Figure 5
Primary and tertiary structure of H-, N-, and K-ras proteins. (a), Sequence comparison with the non-conservative amino acid substitutions highlighted in gold. (b) Mapping the major non-conservative substitutions onto the MD-derived structure. Structural regions involved in function and nucleotide binding are colored in light green (SI), orange (SII), pink (β5-α4, which contains the conserved NKXD motif), and yellow (β6-α5, which contains the conserved Ala146). Lobe 1 is toward bottom.
Figure 6
Figure 6
Solvent accessibility and flexibility of isoforms. (a), Normalized histograms of the solvent accessible surface area (SASA, in Å2) of α4 (residues 126–138) from simulations 1 (black) and 2 (red). Time evolution (2–10 ns) of SASA in K-ras is shown in the inset. (b), Solvent-exposed face of α4 and neighboring regions; residues within 5 Å of Arg135 and Tyr137, which are the two residues with major contribution to the variations in SASA of α4, are shown in licorice. The C-terminal residue 170 is also shown. (c), ΔRMSF of K and N-ras relative to H-ras.
Figure 7
Figure 7
Overlaid maps of i,j(ji + 4)pairwise side chain contacts (see Methods). (a), Overlay of contacts in H-, N- and K-ras. (b–d), Difference contact maps: (b), H-vs-N (i.e., contacts present in H- but not in N-ras, in black) and H-vs-K (red); (c), N-vs-H (black) and N-vs-K (red); (d) K-vs-H (black) and K-vs-N (red). Only contacts existing in at least 50% of frames collected from the 2–10ns portion of each trajectory are considered. Isoform-specific contacts (labeled) are identified by the overlapping black and red symbols, and those between residues distant in sequence (blue labels) are displayed in space-filling model (inset).
Figure 8
Figure 8
Proposed isoform-specific routes of communications between lobe 1 (at the back) and lobe 2 (front). Communications are indicated by rod-connected spheres. The location of the spheres is based on the isoforom-specific contacts in Fig. 7 and is meant to highlight the regions in contact with each other, and not specific atomic interactions. H-ras is in black, N-ras in pink, and K-ras in blue.

References

    1. Abankwa D, Gorfe AA, Hancock JF. Ras nanoclusters: Molecular structure and assembly. Semin Cell Dev Biol. 2007;18:599–607. - PMC - PubMed
    1. Abankwa D, Hanzal-Bayer M, Ariotti N, Plowman S, Gorfe AA, Parton RG, McCammon JA, Hancock JF. A novel switch region regulates H-ras nanoclustering, orientation and signalling. EMBO J. 2008 In press. - PMC - PubMed
    1. Abseher R, Nilges M. Are there non-trivial dynamic cross-correlations in proteins? Journal of Molecular Biology. 1998;279:911–920. - PubMed
    1. Berman HM, Battistuz T, Bhat TN, Bluhm WF, Bourne PE, Burkhardt K, Feng Z, Gilliland GL, Iype L, Jain S, et al. The Protein Data Bank. Acta Crystallogr D Biol Crystallogr. 2002;58:899–907. - PubMed
    1. Berman HM, Westbrook J, Feng Z, Gilliland G, Bhat TN, Weissig H, Shindyalov IN, Bourne PE. The Protein Data Bank. Nucleic Acids Res. 2000;28:235–242. - PMC - PubMed

Publication types