. 2008 Jun 12:9:284.
doi: 10.1186/1471-2164-9-284.

Genomic mid-range inhomogeneity correlates with an abundance of RNA secondary structures

Affiliations

Genomic mid-range inhomogeneity correlates with an abundance of RNA secondary structures

Jason M Bechtel et al. BMC Genomics. .

Abstract

Background: Genomes possess different levels of non-randomness, in particular, an inhomogeneity in their nucleotide composition. Inhomogeneity is manifest from the short-range where neighboring nucleotides influence the choice of base at a site, to the long-range, commonly known as isochores, where a particular base composition can span millions of nucleotides. A separate genomic issue that has yet to be thoroughly elucidated is the role that RNA secondary structure (SS) plays in gene expression.

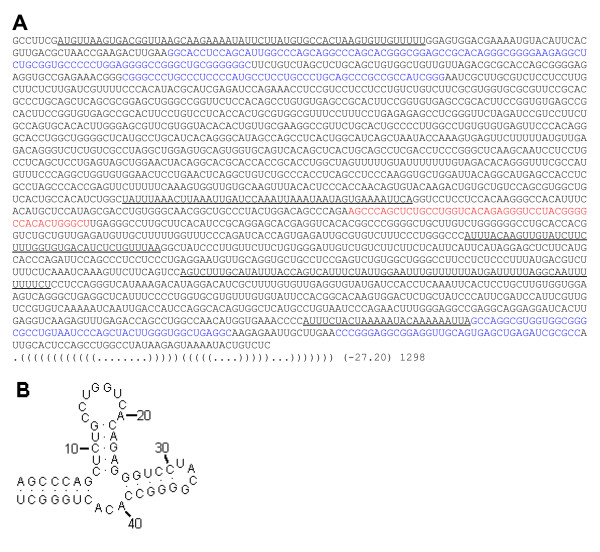
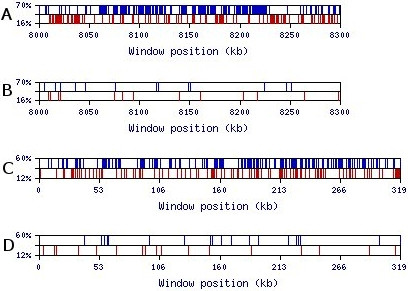
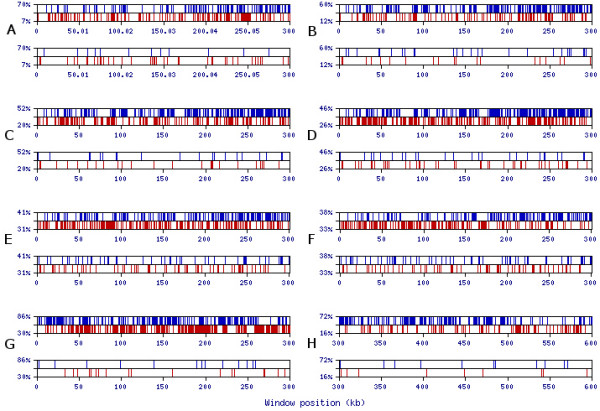
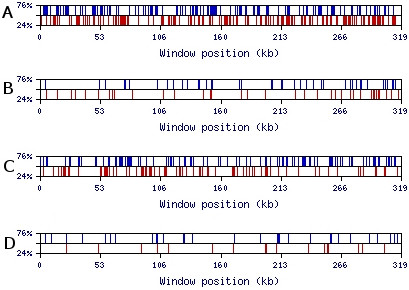
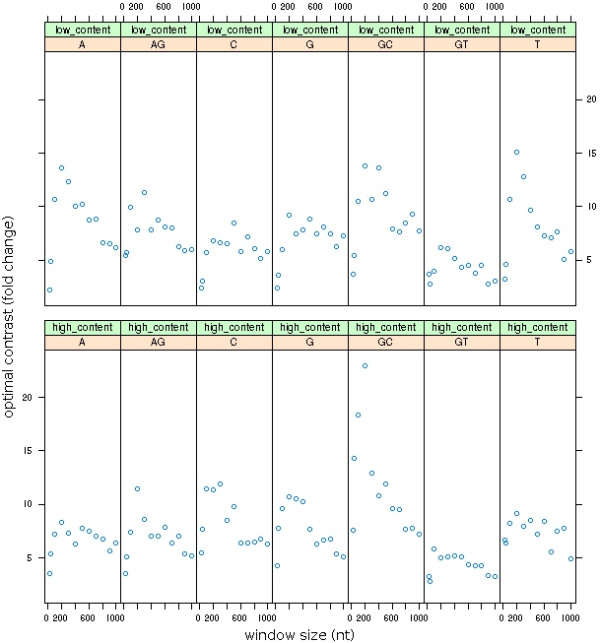
Results: We present novel data and approaches that show that a mid-range inhomogeneity (~30 to 1000 nt) not only exists in mammalian genomes but is also significantly associated with strong RNA SS. A whole-genome bioinformatics investigation of local SS in a set of 11,315 non-redundant human pre-mRNA sequences has been carried out. Four distinct components of these molecules (5'-UTRs, exons, introns and 3'-UTRs) were considered separately, since they differ in overall nucleotide composition, sequence motifs and periodicities. For each pre-mRNA component, the abundance of strong local SS (< -25 kcal/mol) was a factor of two to ten greater than a random expectation model. The randomization process preserves the short-range inhomogeneity of the corresponding natural sequences, thus, eliminating short-range signals as possible contributors to any observed phenomena.

Conclusion: We demonstrate that the excess of strong local SS in pre-mRNAs is linked to the little explored phenomenon of genomic mid-range inhomogeneity (MRI). MRI is an interdependence between nucleotide choice and base composition over a distance of 20-1000 nt. Additionally, we have created a public computational resource to support further study of genomic MRI.


Figures

Figure 1
Figure 1
Distribution of local SS with respect to folding energy in mRNA components and introns. Number of structures was measured within 1 kcal/mol intervals and normalized by 1,000 nucleotides of analyzed sequences.
Figure 2
Figure 2
Distribution of strong local SS with respect to folding energy in mRNAs and genomic sequences. Number of structures was measured within 1 kcal/mol intervals and normalized by 1,000 nucleotides of analyzed sequences. (A) 5'-UTRs (blue) and two independent SRI-generated sequences (gray); (B) 3'-UTRs (yellow) and two independent SRI-generated sequences (gray); (C) introns (green) and two independent SRI-generated sequences (gray); (D) intergenic regions from chromosome 17 (red) and two independent SRI-generated sequences (gray); (E) CDS (burgundy) and two independent CDS-generated sequences (gray); (F) 3'-UTRs (yellow), random MRI-generated counterpart sequences (black), and random SRI-generated counterpart sequences (gray).
Figure 3
Figure 3
Example of a strong local SS in the 3'-UTR of the human KIAA1751 gene [GenBank:NM_001080484]. (A) Nucleotide sequence of the entire 3'-UTR region in which a segment exemplifying a strong local SS (mfe = -27.2 kcal/mol) is shown in red and its schematic base-pairing is shown in dot-bracket notation [23] below the sequence. Other GC-rich regions are highlighted in blue and GC-poor regions are underlined. (B) 2-D representation of this strong SS.
Figure 4
Figure 4
Visualization of MRI-analyzer output for GC-composition of two 300 kb samples using a 50-nt window. Upper and lower thresholds are specified on the y-axis as a percentage of the window size. (A) A sequential sample of human 3'-UTRs from chromosomes 1 and 2 (EID ids 1745_NT_004487 through 2327_NT_022184); (B) a random SRI-generated set based on the tetramer oligonucleotide frequency table of 11,315 human 3'-UTR sequences. (C) The 319 kb sequence of the first extra-large intron of the DMD gene; (D) a random SRI-generated set based on the tetramer oligonucleotide frequency table of the first intron of the DMD gene.
Figure 5
Figure 5
Comparison of MRI-analyses of GC-content for various window sizes and genomic contexts. (A-F) The 319 kb sequence of the first intron from the DMD gene, and its SRI-generated counterpart, analyzed for optimal visual contrast over a range of window sizes (30, 50, 100, 200, 500, 1000) (cf. Figures 4 and 7); (G) The first 300 kb of a sample of human 5'-UTRs and its SRI-generated counterpart using a window size of 50 nt; (H) The 300 kb subset from a sample of intergenic sequences from human chromosome 17 and a corresponding SRI-generated sequence using a window size of 50 nt.
Figure 6
Figure 6
Visualization of MRI-analyzeroutput for AG- and GT-compositions of 319 kb sequence of the first intron of the DMD gene using a 50 nt window. Upper and lower thresholds are specified on the y-axis as a percentage of the window size. (A) AG-rich and AG-poor regions of the DMD intron; (B) AG-rich and AG-poor regions of the corresponding random SRI-generated set based on the tetramer oligonucleotide frequency table of the DMD intron; (C) GT-rich and GT-poor regions of the DMD intron; (D) GT-rich and GT-poor regions of the corresponding random SRI-generated set based on the tetramer oligonucleotide frequency table of the DMD intron.
Figure 7
Figure 7
Optimal contrasts for all content types over a range of window sizes. This figure is the "XY conditioning plot" (from the program Rcmdr 1.2) of the optimal contrasts (see text) for regions of high and low content for all seven possible content types over a range of window sizes (30, 50, 100, 200, 300, ... 1000). The sample sequence is the 319 kb first intron from the DMD gene. The SRI-generated counterpart is constructed from the tetramer frequency table derived from the intron.

References

    1. Buratti E, Baralle FE. Influence of RNA secondary structure on the pre-mRNA splicing process. Mol Cell Biol. 2004;24:10505–10514. doi: 10.1128/MCB.24.24.10505-10514.2004. - DOI - PMC - PubMed
    1. Antequera F. Structure, function and evolution of CpG island promoters. Cellular and Molecular Life Sciences. 2003;60:1647–1658. doi: 10.1007/s00018-003-3088-6. - DOI - PMC - PubMed
    1. Marashi SA, Eslahchi C, Pezeshk H, Sadeghi M. Impact of RNA structure on the prediction of donor and acceptor splice sites. BMC Bioinformatics. 2006;7:297. doi: 10.1186/1471-2105-7-297. - DOI - PMC - PubMed
    1. Kozak M. Regulation of translation via mRNA structure in prokaryotes and eukaryotes. Gene. 2005;361:13–37. doi: 10.1016/j.gene.2005.06.037. - DOI - PubMed
    1. Pickering BM, Willis AE. The implications of structured 5' untranslated regions on translation and disease. Semin Cell Dev Biol. 2005;16:39–47. doi: 10.1016/j.semcdb.2004.11.006. - DOI - PubMed

Publication types

MeSH terms