. 2008 Jun 12;58(5):720-35.
doi: 10.1016/j.neuron.2008.04.001.

Molecular basis of kainate receptor modulation by sodium

Affiliations

Molecular basis of kainate receptor modulation by sodium

Andrew J R Plested et al. Neuron. .

Abstract

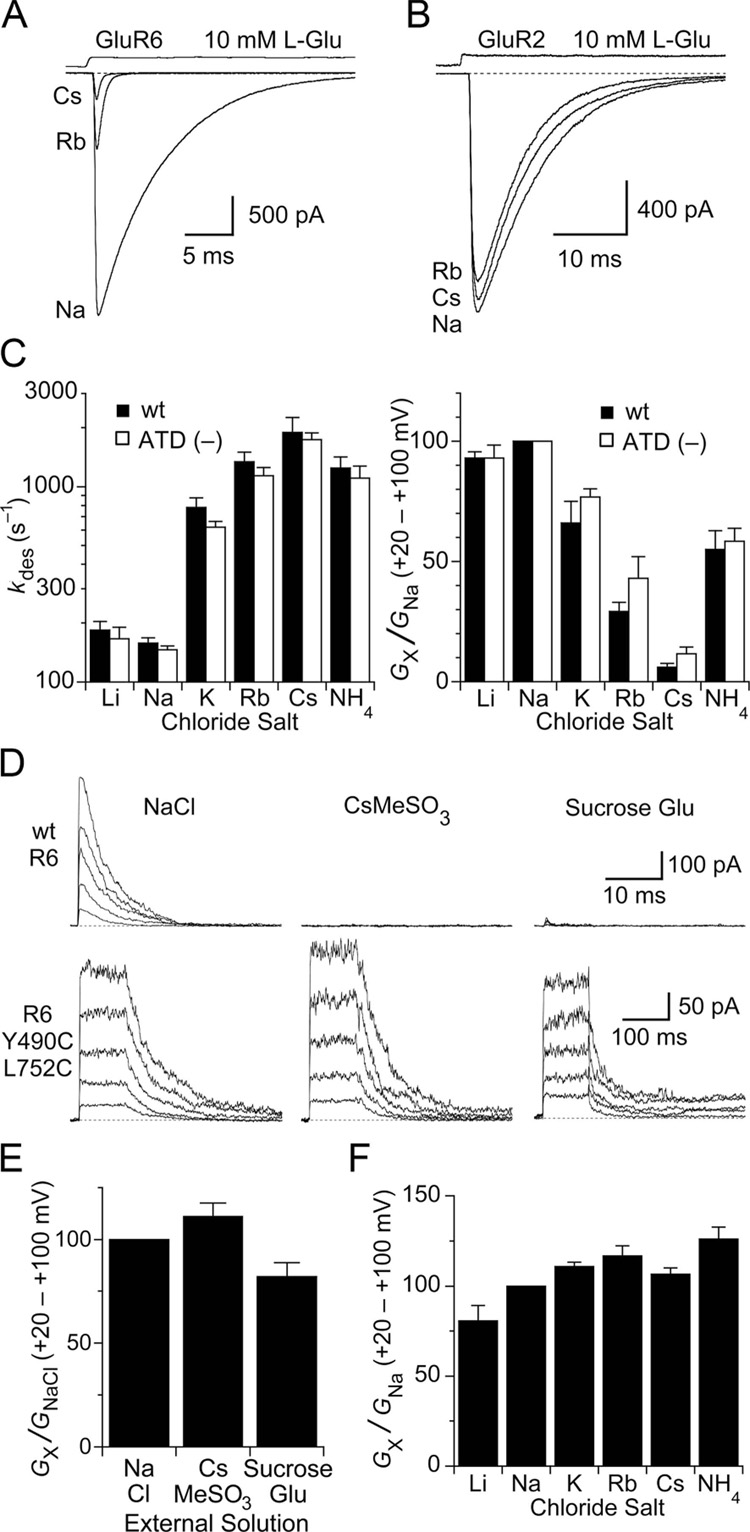
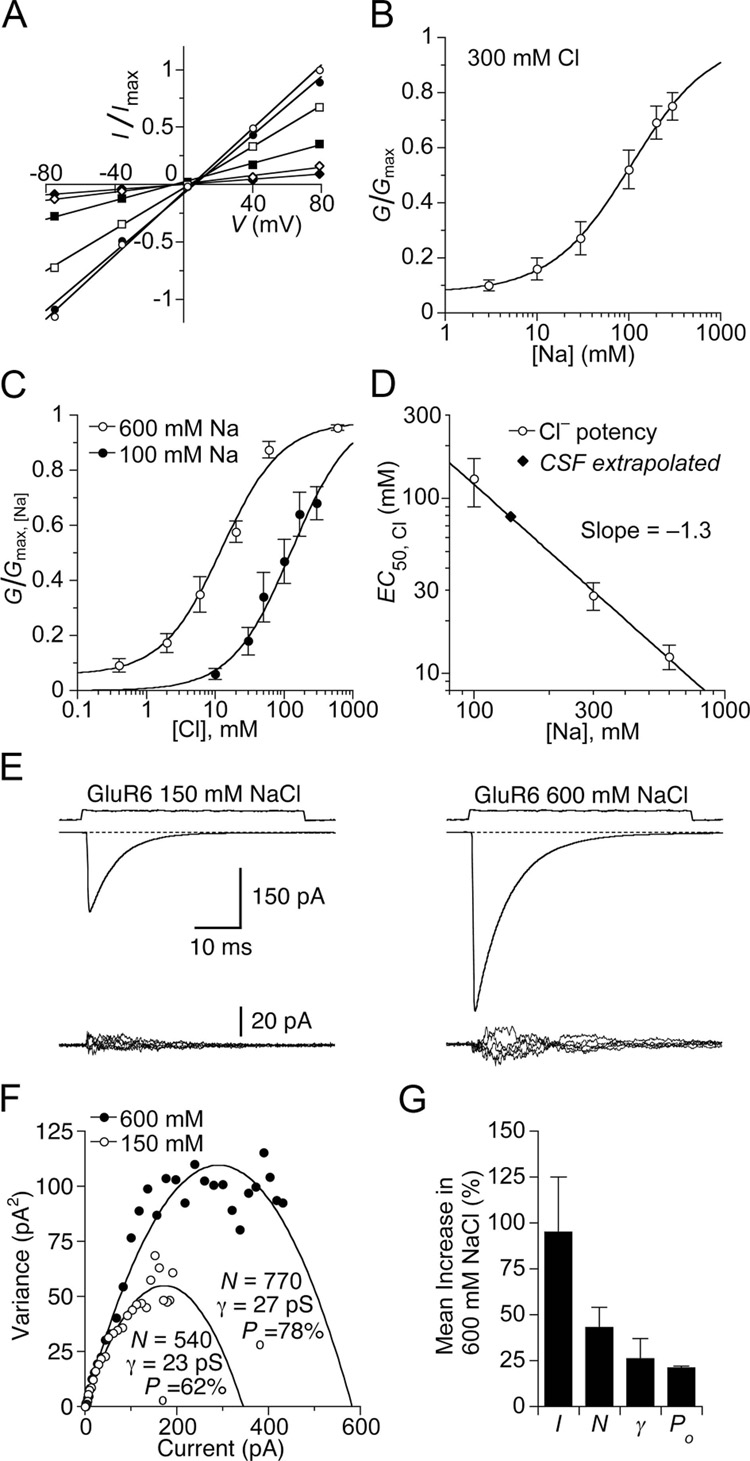
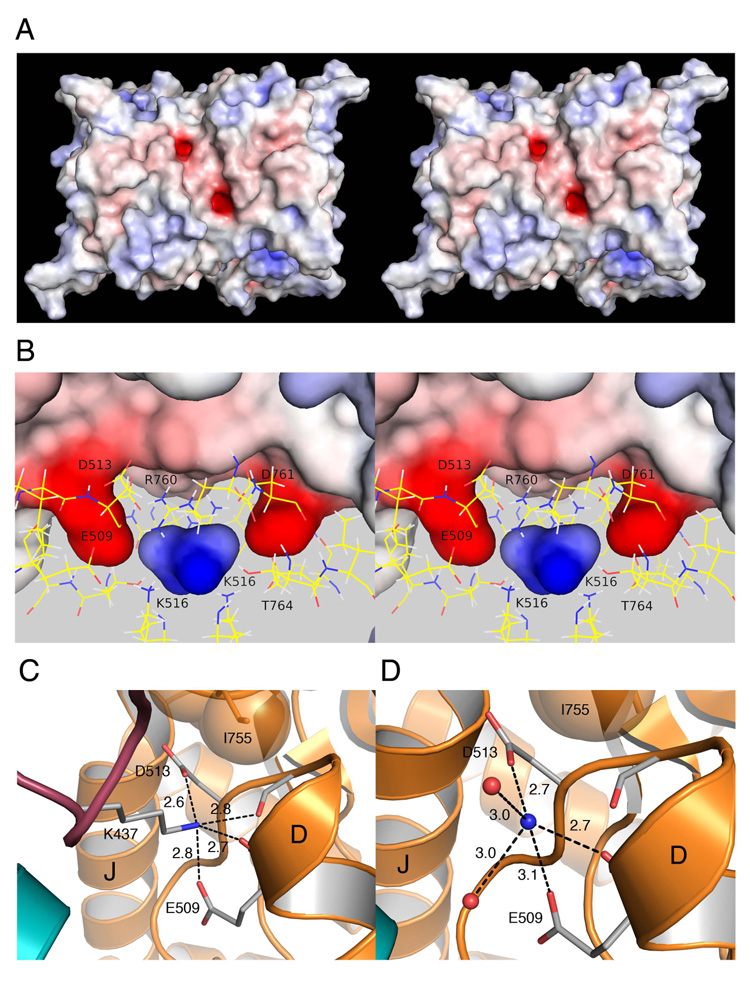
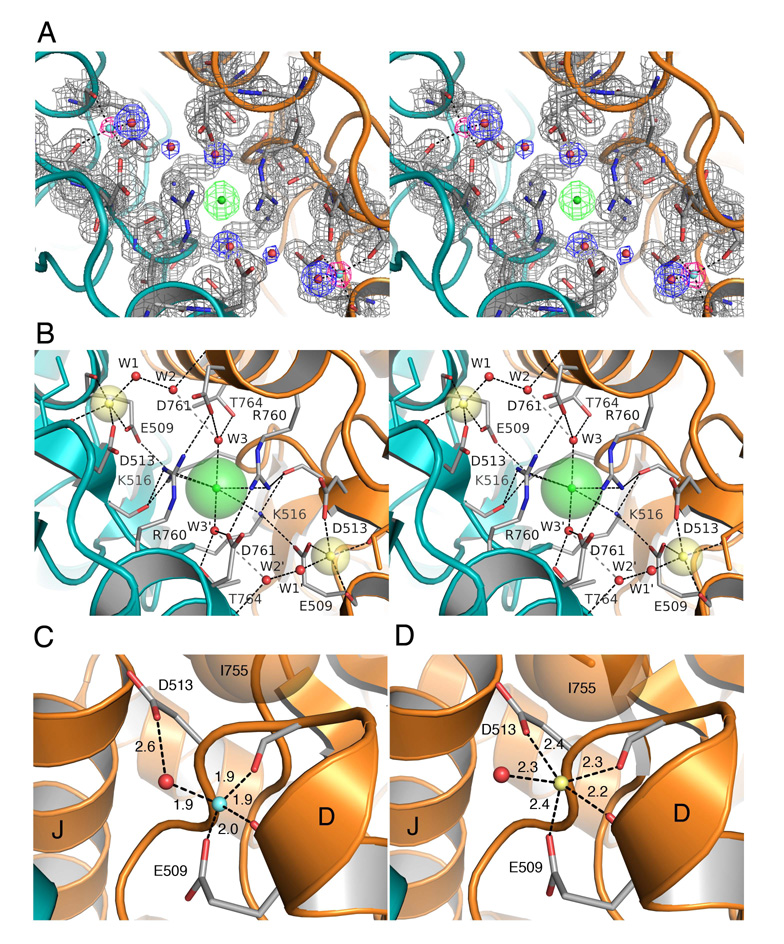
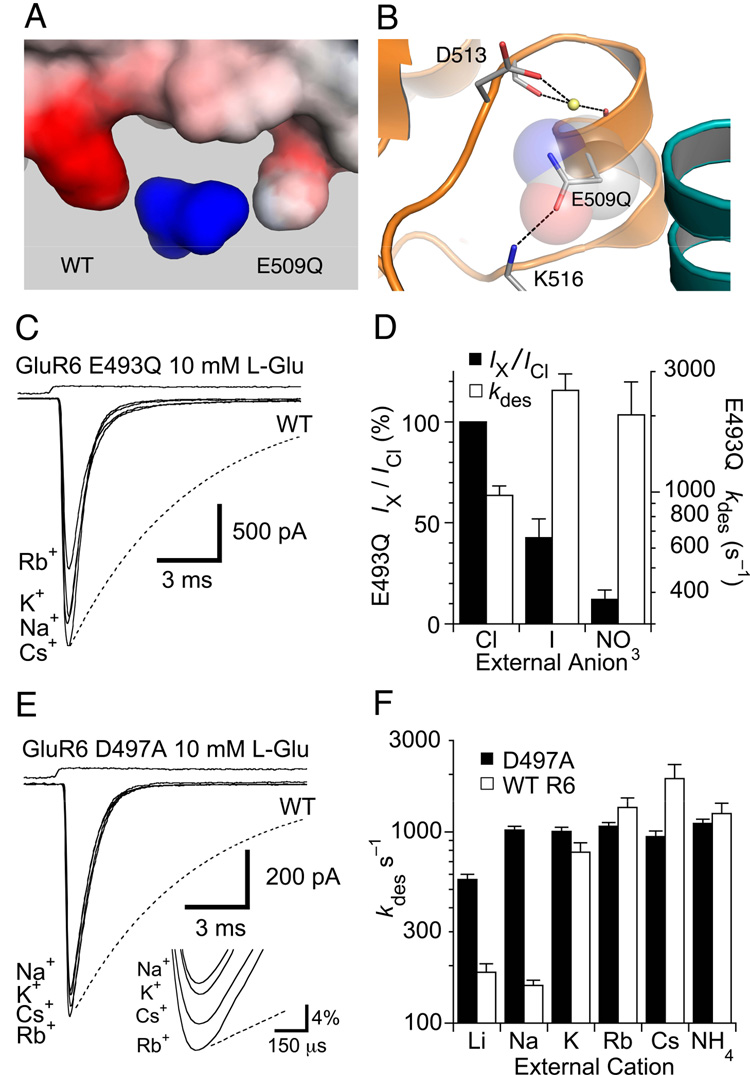
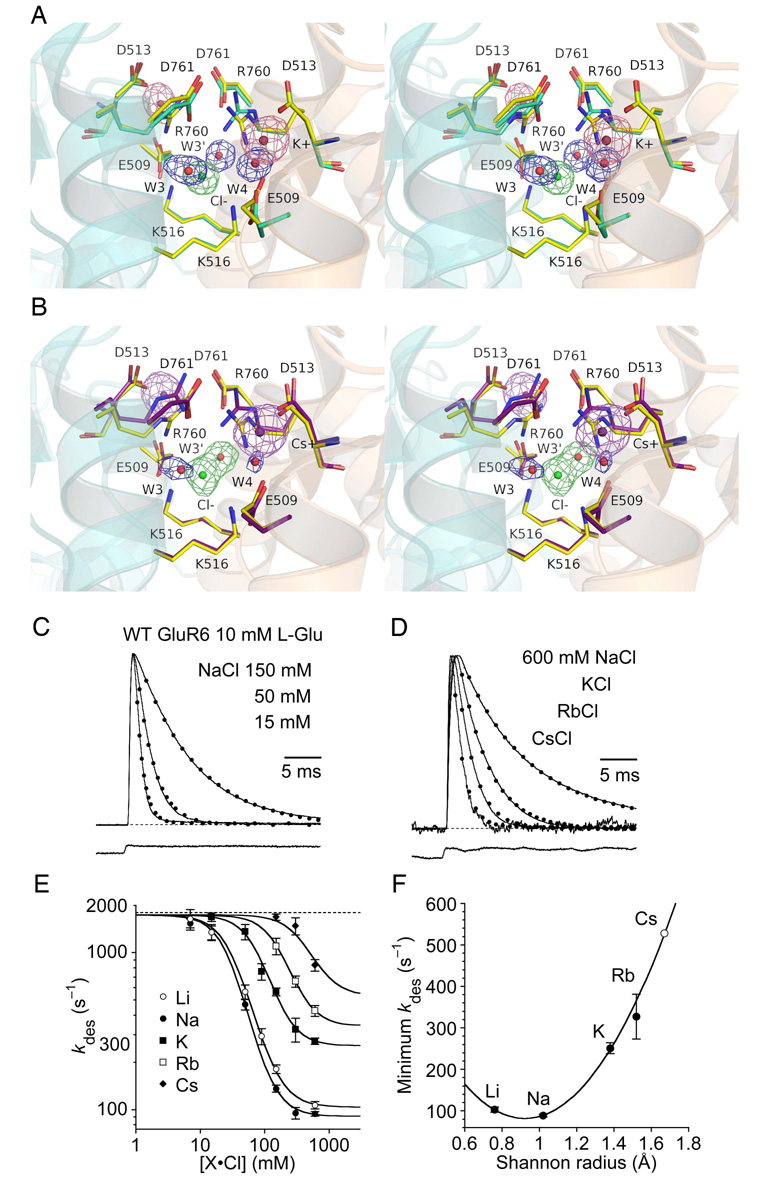
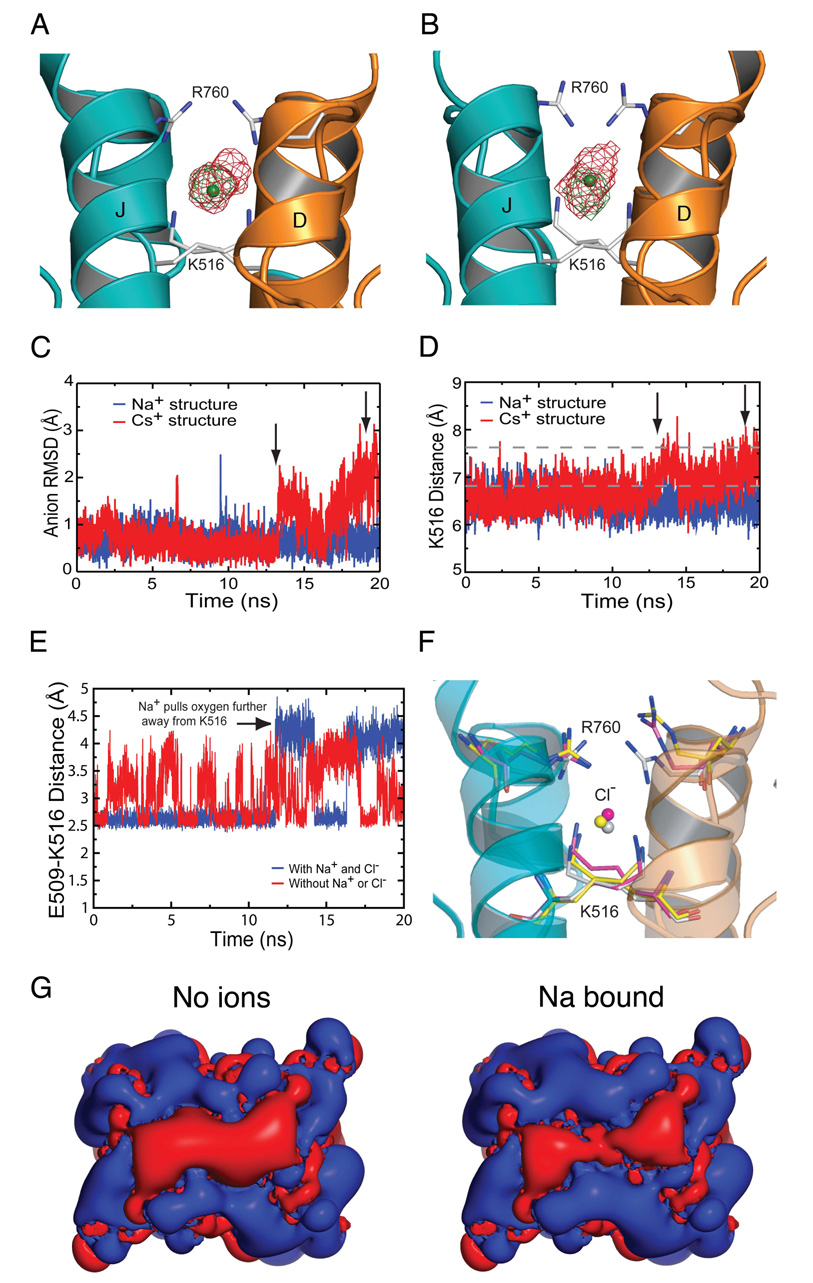
Membrane proteins function in a polarized ionic environment with sodium-rich extracellular and potassium-rich intracellular solutions. Glutamate receptors that mediate excitatory synaptic transmission in the brain show unusual sensitivity to external ions, resulting in an apparent requirement for sodium in order for glutamate to activate kainate receptors. Here, we solve the structure of the Na(+)-binding sites and determine the mechanism by which allosteric anions and cations regulate ligand-binding dimer stability, and hence the rate of desensitization and receptor availability for gating by glutamate. We establish a stoichiometry for binding of 2 Na(+) to 1 Cl(-) and show that allosteric anions and cations bind at physically discrete sites with strong electric fields, that the binding sites are not saturated in CSF, and that the requirement of kainate receptors for Na(+) occurs simply because other cations bind with lower affinity and have lower efficacy compared to Na(+).


Figures

Figure 1
Figure 1. Cations act via sites in the ligand binding domain
(A) GluR6 responses to 10 mM glutamate are reduced in amplitude and desensitize faster when extracellular Na+ is replaced with Rb+ or Cs+. The effects were fully and rapidly reversible on returning to Na+. (B) GluR2flip subtype AMPA receptors show little change in glutamate activated responses after exchange of extracellular Na+ by Rb+ or Cs+. (C) Bar plots summarizing the effects of external monovalent cations on the rate of onset of desensitization (left) and the slope conductance from +20 to +100 mV (right) for responses recorded from wildtype GluR6 and the (ATD–) deletion construct. In all panels, error bars indicate SEM. (D) Responses to 10 mM glutamate recorded at holding potentials of + 20 to + 100 mV for wild type GluR6 (top row) and the non desensitizing GluR6 Y490C/L752C mutant (bottom row) with NaCl, CsMeSO3 or sucrose in the external solution. (E) Bar plot of slope conductance measured from + 20 to + 100 mV for the GluR6 Y490C/L752C mutant in NaCl, CsMeSO3 and sucrose solutions. (F) Bar plot of slope conductance measured from + 20 to + 100 mV for the GluR6 Y490C/L752C mutant in solutions containing Li+, Na+, K+, Rb+, Cs+ or NH4+ as the extracellular monovalent cation.
Figure 2
Figure 2. The Na+ and Cl sites are allosterically coupled and not saturated in CSF
(A) Current-voltage plot for GluR6 responses to 10 mM glutamate recorded in a range of Na+ concentrations (open circles, 300 mM; filled circles, 200 mM; open squares, 100 mM; filled squares, 30 mM; open diamonds, 10 mM; filled diamonds, 3 mM) using Cs+ as a substitute. Glutamate was titrated with CsOH. Slope conductance was fit by linear regression. (B) Na+ concentration response curve for GluR6 fit with a single binding isotherm (EC50 = 110 ± 50 mM), with a constant to account for the residual current at low ion concentration. Data points show the mean ± SEM for six patches. (C) Slope conductance for glutamate responses measured as in (A) but with either 100 or 600 mM Na+, with Cl concentrations varied from 0.3 mM to 600 mM (using MeSO3 as a substitute) fit with single binding isotherms. The apparent affinity for Cl varies with Na+ concentration: 100 mM Na+ EC50 = 130 ± 40 mM; 600 mM Na+ EC50 = 13 ± 3 mM. Data points represent the mean slope conductance ± SEM for six patches for each curve. (D) Plot of Cl EC50 versus Na+ concentration fit by nonlinear regression with a power relation (slope −1.3 ± 0.2). By interpolation, the EC50 for Cl− in physiological saline is about 90 mM. Data points indicate EC50 values and SDs estimated from fits shown in (C); data point at 300 mM is from Plested and Mayer, 2007. (E) Nonstationary analysis of variance of GluR6 responses to 10 mM glutamate. Means of 60–100 traces (upper row) and 5 consecutive difference current traces (lower row) recorded in 150 and 600 mM NaCl from the same patch. The current is substantially and reversibly increased in 600 mM NaCl, when the membrane potential was adjusted to −20 mV to give the same driving force as for responses recorded in 150 mM NaCl. (F) Current-variance plot for responses in (E). In 600 mM NaCl, the number of available receptors and open probability increases compared to 150 mM NaCl. (G) Bar plots for the mean responses of paired observations from six patches; error bars indicate SEM. On average, the current I was increased by 100 ± 30%. The number of receptors N competent for activation by glutamate increased by 43 ± 11%; the conductance γby 26 ± 11 %; and the peak open probability by 21 ± 1%.
Figure 3
Figure 3. The Na+ and Cl binding sites are physically discrete
(A) Stereo view of a surface potential map for the GluR5 kainate complex dimer crystal structure calculated with APBS and contoured from −10 kT/e (red) to +10 kT/e (blue). The view is face on to the plane of the membrane with the N terminus facing upwards. The two electronegative pockets were the most prominent features on the protein surface. (B) Stereo view of the protein interior with the molecular surface colored by surface potential; side chains forming the cation and anion binding sites drawn in stick configuration; the view is rotated by ≈ 90° from than in A. The electropositive cavity located between the two ‘fingers’ projecting into the protein interior forms the binding site for Cl. (C) Crystal structure of the GluR5 complex with the antagonist UBP310 at 1.74 Å resolution (PDB 2F34) showing plugging of the cation binding pocket by the side chain of Lys437 from an adjacent subunit. (D) Crystal structure of the GluR5 kainate complex with NH4+ in the cation binding site at 1.68 Å resolution; dashed lines indicate protein contacts within hydrogen bond or salt bridge distance from the NH4+ ion. Labels identify helices D and J; in this and subsequent figures the pair of subunits in a dimer assembly are shaded gold and cyan respectively.
Figure 4
Figure 4. High resolution crystal structures of the Li+ and Na+ complexes
(A) Stereo view of the GluR5 kainate complex with Li+ at 1.49 Å resolution. Electron density for the pair of Li+ ions is shown for an Fo-Fc omit map (pink) contoured at 3.2 σ, with Li+ omitted from the Fc calculation. Electron density for the protein (gray), water molecules (blue), and the Cl ion (green) is shown for a 2mFo-DFc map contoured at 1.5 σ. (B) Stereo view of the Na+ complex looking down the molecular two-fold axis of the dimer assembly onto the plane of the membrane; transparent spheres for the bound ions are drawn using Shannon radii; the Na+ and Cl ions are linked in a network formed by the side chains of Glu509 and Lys516. Numerous salt bridges and hydrogen bonds link the subunits together. (C) Crystal structure of the GluR5 kainate complex with Li+ in the cation binding site showing tetrahedral coordination of the ion by the side chains of Glu509, Asp 513, the main chain carbonyl oxygen of Glu509, and a H2O molecule, with bond distances in Å. (D) Crystal structure of the GluR5 kainate complex at 1.72 Å resolution with Na+ in the cation binding site showing 5-fold coordination of the Na+ ion, and block of the 6th coordination site by the side chain of Ile755.
Figure 5
Figure 5. Cation binding site mutations speed desensitization
(A) View of the molecular surface of the anion and cation binding sites colored by surface potential for a GluR5 dimer with one wild type and one E509Q mutant subunit, viewed from the protein interior, and contoured from −10 kT/e (red) to +10 kT/e (blue). (B) The surface potential calculation was performed with the E509Q mutant side chain oriented with its carbonyl group within hydrogen bonding distance of the Lys516 side chain amino group and the amide group facing the Na+ ion. (C) The equivalent mutation for GluR6 (E493Q) speeds desensitization compared to responses for wild-type GluR6 measured in NaCl (dotted line). Responses measured from the same patch with K+, Rb+ or Cs+ as the external monovalent cation, showed similar rapid desensitization, and the peak amplitude was much less sensitive to cation species than for wild type. (D) Bar plots summarizing the change in peak amplitude and rate of onset of desensitization for GluR6 E493Q responses measured with Na+ and either chloride, iodide or nitrate as the extracellular anion. The bars show the mean for 5–8 patches, error bars represent SEM. (E) The GluR6 D497A mutant speeds desensitization compared to responses for wild-type GluR6 measured in NaCl (dotted line). Responses to 10 mM glutamate with Na+, K+, Rb+ or Cs+ measured in the same patch were almost identical in amplitude (see inset), with desensitization rates about six times faster than for wild-type responses in NaCl (dotted line). (F) Bar plots summarizing the change in peak amplitude for wild type GluR6 and the GluR6 D497A mutant with Li+, Na+, K+, Rb+, Cs+ or NH4+ as the external monovalent cation; error bars represent SEM.
Figure 6
Figure 6. The cation binding site shows weak selectivity for Na+
(A) Stereo view of the K+ complex crystal structure at 1.72 Å resolution with an Fo-Fc omit map contoured at 3.5 σ for the K+ (pink) and Cl (green) ions and H2Omolecules (blue) omitted from the Fc calculation. Density for the Cl ion and its adjacent H2O molecules W3 and W3’ are well resolved as individual peaks. Side chains which form the ion binding sites are drawn in stick representations. The rest of the protein is drawn as a transparent ribbon diagram, with helix J foremost for the left subunit, and helix D foremost for the right subunit. The structure is superimposed on that for the Na+ complex using domain 1 Cα coordinates with an rmsd of 0.20 Å; carbon atoms for the K+ complex side chains are colored pale green and those for the Na+ complex yellow. In the right subunit of the K+ complex the side chain for Arg760 has flipped into an ‘up’ conformation creating a hole filled by W4. (B) Stereo view of the Cs+ complex crystal structure at 1.97 Å resolution oriented as in A, with an Fo-Fc omit map contoured at 3.5 σ for Cs+ (purple) and Cl (green) ions and H2O molecules (blue) which were omitted from the Fc calculation. Note that density for the Cl ion and W3’ is continuous, while that for W3 is weak compared to adjacent atoms. The structure is superimposed on that for the Na+ complex using domain 1 Cα coordinates with an rmsd of 0.19 Å; carbon atoms for the Cs+ complex side chains are colored purple and those for the Na+ complex yellow. In the both subunits of the Cs+ complex the side chain for Arg760 have flipped into an ‘up’ conformation. (C) Outward currents activated by 10 mM glutamate for wild type GluR6 recorded in the same patch at + 30 mV in 150, 50 and 15 mM external NaCl (sucrose used to maintain osmotic pressure); currents were normalized to the response in 150 mM NaCl and fit with monoexponential decays (dotted lines) with kdes = 120, 410 and 950 s−1 respectively. The bottom trace is the junction current recorded at the end of the experiment. (D) Outward currents activated by 10 mM glutamate for wild type GluR6 recorded in the same patch with either 600 mM NaCl, KCl, RbCl, or CsCl. The currents were normalized to the response in 600 mM NaCl and fit with monoexponential decays (dotted lines) with kdes = 100, 240, 400 and 675 s−1 respectively. The bottom trace is the junction current recorded at the end of the experiment. (E) Rate of desensitization with salt concentrations from 6 to 600 mM globally fit by non-linear least squares with a binding isotherm; the curves were constrained to be parallel and to have a common maxima of 1743 s−1; the slope was very close to 2; the freely fitted minima were 103 ± 6, 89 ± 3, 250 ± 10 and 330 ± 50 s−1 for Li+, Na+, K+ and Rb+ respectively. Data points represent the mean ± SEM of the desensitization rate measured in at least five patches. (F) The minimum rate of desensitization, plotted against Shannon radius, fit with a parabolic function by non-linear regression; the value for Cs+ is extrapolated from the fit. The parabola has a minimum close to the sodium radius, corresponding to kdes, min = 82 ± 3 s−1. Data points represent the minimum fitted rate ± the approximate SD from the fit in (E); we used this relation to fix the minimum desensitization rate in CsCl to be 530 s−1.
Figure 7
Figure 7. MD simulations reveal an interdependence of anion and cation mobility
(A) Isocontour map of the Cl ion position from a simulation of the Na-bound structure with Na+ and Cl in the binding site (green) and from a simulation with no Na+ present (red). (B) Isocontour map of the Cl ion position from a simulation of the Cs-bound structure. The green map is from the data before the Cs+ ion leaves (0–13 ns). The red map is for the whole simulation (0–20 ns). (C) RMSD of the Cl ion in the Na-bound simulation (blue) and in the Cs-bound simulation (red). Arrows mark the time points at which the Cs+ ions leave the binding sites, the first at 13 ns and the second at 19 ns. (D) Distance between the NZ atoms of K516 as a function of time for the Na-bound simulation (blue) and the Cs-bound simulation (red). The increase in distance coincides with the Cs+ ions leaving the protein. Dashed lines indicate the mean RMSD of the Cl ion for two simulations run with Na+ omitted from the cation binding site. (E) Distance between E509 OE1 and K516 NZ atoms for the simulation with Na+ ions present (blue) and without Na+ ions (red) in the binding pocket. (F) Multiple conformations for R760 observed in MD simulations. The R760 structure from subunit A that is most representative of the largest cluster is shown in pink as are the corresponding K516 and Cl atoms. The equivalent analysis for R760 from subunit B is shown in yellow. The crystal structure conformations for R750 and K516 in the Na+ complex are shown as white sticks. (G) Isopotential surface maps calculated with APBS and contoured at −0.5 kT/e (red) and +0.5 kT/e (blue); view is the same as Figure 3. The panels on the left and right show the field with the cation site unoccupied and with Na+ bound respectively.

References

    1. Alvarez O, Gonzalez C, Latorre R. Counting channels: a tutorial guide on ion channel fluctuation analysis. Adv Physiol Educ. 2002;26:327–341. - PubMed
    1. Armstrong N, Gouaux E. Mechanisms for activation and antagonism of an AMPA-sensitive glutamate receptor: Crystal structures of the GluR2 ligand binding core. Neuron. 2000;28:165–181. - PubMed
    1. Armstrong N, Jasti J, Beich-Frandsen M, Gouaux E. Measurement of conformational changes accompanying desensitization in an ionotropic glutamate receptor. Cell. 2006;127:85–97. - PubMed
    1. Baker NA, Sept D, Joseph S, Holst MJ, McCammon JA. Electrostatics of nanosystems: application to microtubules and the ribosome. Proc Natl Acad Sci U S A. 2001;98:10037–10041. - PMC - PubMed
    1. Berendsen HJC, Postma JPM, van Gunsteren WF, DiNola A, Haak JR. Molecular dynamics with coupling to an external bath. The Journal of Chemical Physics. 1984;81:3684–3690.

Publication types

MeSH terms

LinkOut - more resources