. 2008 Aug 8;283(32):21934-44.
doi: 10.1074/jbc.M802481200. Epub 2008 Jun 11.

Differential regulation of STAT family members by glycogen synthase kinase-3

Affiliations

Differential regulation of STAT family members by glycogen synthase kinase-3

Eléonore Beurel et al. J Biol Chem. .

Abstract

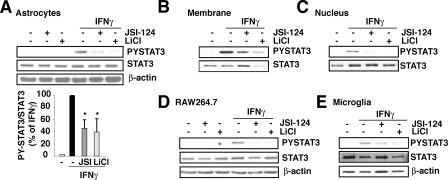
Excessive neuroinflammation contributes to many neurological disorders and is poorly controlled therapeutically. The signal transducer and activator of transcription (STAT) family of transcription factors has a central role in inflammatory reactions, being stimulated by multiple cytokines and interferons and regulating the expression of many proteins involved in inflammation. We found that STAT3 activation is highly dependent on glycogen synthase kinase-3 (GSK3). Inhibitors of GSK3 greatly reduced (>75%) the activating STAT3 tyrosine phosphorylation in mouse primary astrocytes, microglia, and macrophage-derived RAW264.7 cells induced by interferon-gamma (IFNgamma), IFNalpha, interleukin-6, or insulin. GSK3 inhibitors blocked STAT3 DNA binding activity and the expression of STAT3-induced GFAP and Bcl-3. GSK3 dependence was selective for activation of STAT3 and STAT5, whereas STAT1 and STAT6 activation were GSK3-independent. Knockdown of the two GSK3 isoforms showed STAT3 and STAT5 activation were dependent on GSK3beta, but not GSK3alpha. The regulatory mechanism involved GSK3beta binding STAT3 and promoting its association with the IFNgamma receptor-associated intracellular signaling complex responsible for activating STAT3. Furthermore, GSK3beta associated with the IFNgamma receptor and was activated by stimulation with IFNgamma. Thus, inhibitors of GSK3 reduce the activation of STAT3 and STAT5, providing a mechanism to differentially regulate STATs to modulate the inflammatory response.


Figures

FIGURE 1.
FIGURE 1.
GSK3 promotes STAT3 activation. A, mouse primary astrocytes were treated with 1 ng/ml IFNγ, 100 ng/ml LPS, or both for 15 min to 4 h, and cell lysates were immunoblotted for phospho-Tyr705-STAT3 and total STAT3. Mouse primary astrocytes were treated with 100 ng/mlLPS, 1 ng/ml IFNγ, or both, in the absence or presence of 20 mm lithium (LiCl) (B) for 15 min to 6 h or (C) for 30 min, followed by analysis of cell lysates by immunoblotting with phosphorylation-specific antibodies to assess the phosphorylation of STAT3 (Tyr705 and Ser727) (n = 4). D, mouse primary astrocytes were treated with 100 ng/ml LPS and/or 1 ng/ml IFNγ for 30 min without or with a pretreatment of 30 min with 20 mm lithium (LiCl) or 10 μm other GSK3 inhibitors (SB415286, SB216763, indirubin-3′-monoxime, and TDZD-8), and cell lysates were analyzed by immunoblotting. E, mouse primary astrocytes were treated with 1 ng/ml IFNγ for 30 min without or with a pretreatment of 30 min with 2, 5, 10, or 20 mm lithium, or 1, 2, 4, or 10 μm SB216763, and cell lysates were immunoblotted for phospho-Tyr705-STAT3 and total STAT3. RAW264.7 cells (F) or primary microglia (G) were treated with 100 ng/ml LPS and/or 1 ng/ml IFNγ for 30 min without or with a pretreatment of 30 min with 20 mm lithium (LiCl) or 10μm of other GSK3 inhibitors (SB415286, SB216763, indirubin-3′-monoxime, kenpaullone, and TDZD-8), and cell lysates were analyzed by immunoblotting. The ratio of phospho-Tyr705-STAT3 (PYSTAT3) to total STAT3 was calculated, and values represent the mean ± S.E.; n = 3–4. Immunoblots were reblotted for β-actin to ensure equal protein loading.
FIGURE 2.
FIGURE 2.
GSK3 inhibitors block STAT3 transcription factor activity. Mouse primary astrocytes were treated (A) for 5, 30, 60 or 120 min with 1 ng/ml IFNγ without or with 20 mm lithium (LiCl), or (B) for 30 min with 1 ng/ml IFNγ, 100 ng/ml LPS, or both, without or with 10 μm TDZD-8, and nuclear fractions were immunoblotted for phospho-Tyr705-STAT3 (PYSTAT3) (n = 3). C, STAT3 DNA binding activity was measured in astrocytes after 30-min stimulation with 1 ng/ml IFNγ modulated by treatments with 20 mm lithium or 10 μm TDZD-8. Values represent the mean ± S.E.; n = 5, *, p < 0.05 compared with samples not treated with a GSK3 inhibitor. Constitutively active STAT3C was expressed after infection with the FLAG-tagged STAT3 adenovirus (Ad5STAT3C) in mouse primary astrocytes for 24 h without or with 20 mm lithium (LiCl), and cell lysates were analyzed by immunoblotting for phospho-Tyr705-STAT3 (D) or GFAP or Bcl-3 (E). The ratio of phospho-Tyr705-STAT3 (PYSTAT3) to total STAT3 or the total levels of GFAP or Bcl-3 were calculated, and values represent the mean ± S.E.; n = 3–4. F, mouse primary astrocytes were treated for 24 h, 48 h, or 72 h without or with 20 mm lithium (LiCl), and cell lysates were analyzed by immunoblotting. The level of GFAP was calculated and values represent the mean ± S.E.; n = 3.
FIGURE 3.
FIGURE 3.
GSK3 inhibitors block phospho-Tyr705-STAT3. Mouse primary astrocytes were treated with 1 ng/ml IFNγ for 30 min, with or without a 30-min pretreatment with 10 μm JSI-124 or 20 mm lithium, and cell lysates (A), membrane (B), or nuclear fractions (C) were analyzed by immunoblotting. The ratios of phospho-Tyr705-STAT3 (PYSTAT3) to total STAT3 were calculated and values represent the mean ± S.E.; n = 4, *, p < 0.05 compared with IFNγ alone. RAW264.7 cells (D) or microglia (E) were treated with 1 ng/ml IFNγ for 30 min, with or without a 30-min pretreatment with 10 μm JSI-124 or 20 mm lithium, and cell lysates were analyzed by immunoblotting. Immunoblots were reblotted for β-actin for cell lysates or CREB for nuclear lysates to ensure equal protein loading.
FIGURE 4.
FIGURE 4.
GSK3 promotes the activation of STAT3 induced by other stimulants. A, mouse primary astrocytes were treated with 50 ng/ml IL-6 for 30 min, in the absence or presence of a 30-min pretreatment with 10 μm JSI-124 or 20 mm lithium (LiCl), and lysates were immunoblotted for phospho-Tyr705-STAT3 and STAT3. B, mouse primary astrocytes and RAW264.7 cells were treated with 103 units/ml IFNα or 50 ng/ml insulin for 30 min in the absence or presence of a 30-min pretreatment with 20 mm lithium (LiCl) or 10 μm SB216763, and lysates were immunoblotted for phospho-Tyr705-STAT3 and STAT3 (n = 3). Immunoblots were reblotted for β-actin to ensure equal protein loading.
FIGURE 5.
FIGURE 5.
GSK3 is not a strong modulator of STAT1 and STAT6 but activates STAT5. A, mouse primary astrocytes (left panel) or RAW264.7 cells (right panel) were treated with 100 ng/ml LPS and 1 ng/ml IFNγ for 30 min without or with a pretreatment of 30 min with 20 mm lithium (LiCl) or 10 μm other GSK3 inhibitors (SB415286, SB216763, indirubin-3′-monoxime, kenpaullone, TDZD-8, and GSK3 inhibitor II), and cell lysates were analyzed by immunoblotting for phospho-Tyr701-STAT1 and STAT1 (n = 3). B, RAW264.7 cells (top panel) and primary microglia (bottom panel) were treated with 103 units/ml IFNα or 1 ng/ml IFNγ for 30 min without or with a pretreatment of 30 min with 20 mm lithium (LiCl) or 10 μm SB216763, and cell lysates were analyzed by immunoblotting for phospho-Tyr701-STAT1 and STAT1 (n = 2). C, mouse primary astrocytes (left panel), RAW264.7 cells (middle panel), and mouse primary microglia (right panel) were treated with 25 ng/ml IL-4 for 30 min without or with a pretreatment of 30 min with 20 mm lithium (LiCl) or 10 μm other GSK3 inhibitors (SB415286, SB216763, kenpaullone, TDZD-8, and GSK3 inhibitor II), and cell lysates were analyzed by immunoblotting for phospho-Tyr641-STAT6 and STAT6 (n = 4). D, mouse primary astrocytes were treated with 103 units/ml IFNα or 1 ng/ml IFNγ for 30 min without or with a pretreatment of 30 min with 20 mm lithium (LiCl) or 10 μm other GSK3 inhibitors (SB216763, BIO, and TDZD-8), and cell lysates were analyzed by immunoblotting for phospho-Tyr694-STAT5 and STAT5. The ratio of phospho-Tyr694-STAT5 (PYSTAT5) to total STAT5 was calculated, and values represent the mean ± S.E. n = 3. E, mouse primary microglia were treated with 1 ng/ml IFNγ or 25 ng/ml GM-CSF for 30 min without or with a pretreatment of 30 min with 20 mm lithium (LiCl) or 10 μm other GSK3 inhibitors (BIO and TDZD-8), and cell lysates were analyzed by immunoblotting for phospho-Tyr694-STAT5 and STAT5 (n = 3). Immunoblots were reblotted for β-actin to ensure equal protein loading.
FIGURE 6.
FIGURE 6.
GSK3β isoform is responsible for the phospho-Tyr705-STAT3. Mouse primary astrocytes were treated with control siRNA (Ctl) or siRNA for GSK3α and GSK3β for 48 h followed by stimulation with 1 ng/ml IFNγ for 30 min, and cell lysates were analyzed by immunoblot. The level of GSK3α (left) and GSK3β (right) are shown in A. Cell lysates were analyzed by immunoblot. The ratio of phospho-Tyr705-STAT3 (PYSTAT3) to total STAT3 (B) and phospho-Tyr694-STAT5 to STAT5 (C) was calculated, and values represent the mean ± S.E.; n = 5; *, p < 0.05 compared with control. D, control green fluorescent protein or constitutively active S21A-GSK3α and S9A-GSK3β were expressed in mouse primary astrocytes for 48 h. Cell lysates were analyzed by immunoblot (n = 3). Immunoblots were reblotted for β-actin to ensure equal protein loading.
FIGURE 7.
FIGURE 7.
STAT3 inhibition by GSK3 is not mediated by phosphatases or JAKs. A, mouse primary astrocytes were treated for 30 min with 0.1 mm pervanadate, 1 ng/ml IFNγ, and 20 mm lithium (LiCl) as indicated, followed by immunoblotting nuclear or cytosolic extracts (PY indicates total phosphotyrosine immunoreactivity) (n = 2). B, mouse primary astrocytes; C, RAW264.7 cells; or D, mouse primary microglia were treated for 30 min with 1 ng/ml IFNγ and 100 ng/ml LPS, without or with 20 mm lithium (LiCl) or 10 μm other GSK3 inhibitors (SB415286, SB216763, kenpaullone, TDZD-8, and GSK3 inhibitor II). Cell lysates were analyzed by immunoblot for phospho-Tyr1007/1008-JAK2 and JAK2 (n = 4). E, mouse primary astrocytes, microglia, and RAW264.7 cells were treated for 30 min with 1 ng/ml IFNγ, without or with 20 mm lithium (LiCl) or 10 μm SB216763. Cell lysates were analyzed by immunoblot for phospho-Tyr1022/1023-JAK1 and JAK1 or phospho-Tyr1054/1055-TYK2. Immunoblots were reblotted with β-actin to ensure equal protein loading.
FIGURE 8.
FIGURE 8.
GSK3 associates with STAT3. A, GSK3α or GSK3β were immunoprecipitated (IP) from cell lysates of primary astrocytes treated for 30 min with 1 ng/ml IFNγ, and immunoprecipitated lysates were immunoblotted for STAT3 and GSK3α/β. The level of STAT3 associated with each isoform of GSK3 was evaluated, and values represent the mean ± S.E. (n = 3). STAT3 was immunoprecipitated from membrane (B) or nuclear fractions (C) prepared from primary astrocytes treated for 30 min with 1 ng/ml IFNγ, 100 ng/ml LPS, or both, and immunoprecipitated lysates were immunoblotted for GSK3α/β and STAT3 (n = 4). To ensure the efficiency of the immunoprecipitation, the recovery in the supernatant after immunoprecipitation (Sup.) was performed. D, the IFNγ receptor α-chain (CD119) or STAT3 (E) was immunoprecipitated from membrane fractions prepared from mouse primary astrocytes after infection with adenovirus for the expression of green fluorescent protein (control), constitutively active S9A-GSK3β, or constitutively active S21A-GSK3α, without or with constitutively active FLAG-tagged STAT3C (Ad5STAT3C), for 48 h, and immunoprecipitated lysates were immunoblotted for GSK3α/β, CD119, or STAT3. (n = 3). To ensure the specificity and the efficiency of the immunoprecipitation, an immunoprecipitation with a nonspecific isotypic IgG and the recovery in the supernatant after immunoprecipitation (Sup) were performed. F, astrocytes were treated with control siRNA (Ctl) or siRNA for GSK3α and GSK3β for 48 h followed by a pretreatment for 2 h with 10 ng/ml leptomycin B (LMB) and then addition of IFNγ (1 ng/ml) for 2 h, and nuclear fractions were immunoblotted. The level of phospho-Tyr705-STAT3 (PY-STAT3) was calculated, and values represent the mean ± S.E. (n = 5). Immunoblots were reblotted with CREB to ensure equal protein loading.
FIGURE 9.
FIGURE 9.
GSK3 is active at the IFNγ receptor. Co-immunoprecipitation (IP) of GSK3α/β with IFNγ receptor α-chain (CD119) (A), or TLR4 from membrane fractions (B) of mouse primary astrocytes, including untreated cells and following 30-min stimulation with 1 ng/ml IFNγ, 100 ng/ml LPS, or both. GSK3 activity was measured in CD119 or TLR4 immunoprecipitants from primary astrocytes. To ensure the specificity and the efficiency of the immunoprecipitation, an immunoprecipitation with a nonspecific isotypic IgG and the recovery in the supernatant after immunoprecipitation (Sup) were performed. Quantified data are presented as mean ± S.E.; n = 5, *, p < 0.05 compared with control. Primary mouse astrocytes were infected with the constitutively active, FLAG-tagged STAT3 adenovirus (Ad5STAT3C) for 24 h, and CD119 from cell lysates was immunoprecipitated (IP) after treatment with 20 mm lithium (LiCl) (C); 20 mm lithium, 10 μm TDZD-8, or 10 μm SB415286 for 4 h (D); 1 ng/ml IFNγ for 30 min (E); or 1 ng/ml IFNγ and 20 mm lithium (F), and immunoblotted for FLAG and CD119 (n = 4).

References

    1. Campbell, I. L. (2005) Brain Res. Brain Res. Rev. 48 166–177 - PubMed
    1. Maragakis, N. J., and Rothstein, J. D. (2006) Nat. Clin. Pract. Neurol. 2 679–689 - PubMed
    1. Zipp, F., and Aktas, O. (2006) Trends Neurosci. 29 518–527 - PubMed
    1. Levy, D. E., and Darnell, J. E., Jr. (2002) Nat. Rev. Mol. Cell. Biol. 3 651–662 - PubMed
    1. Brierley, M. M., and Fish, E. N. (2005) J. Interferon Cytokine Res. 25 733–744 - PubMed

Publication types

MeSH terms