Comparative Study
. 2009 Mar;19(3):511-23.
doi: 10.1093/cercor/bhn101. Epub 2008 Jun 11.

Synapsin- and actin-dependent frequency enhancement in mouse hippocampal mossy fiber synapses

Affiliations
Comparative Study

Synapsin- and actin-dependent frequency enhancement in mouse hippocampal mossy fiber synapses

Simen G Owe et al. Cereb Cortex. 2009 Mar.

Abstract

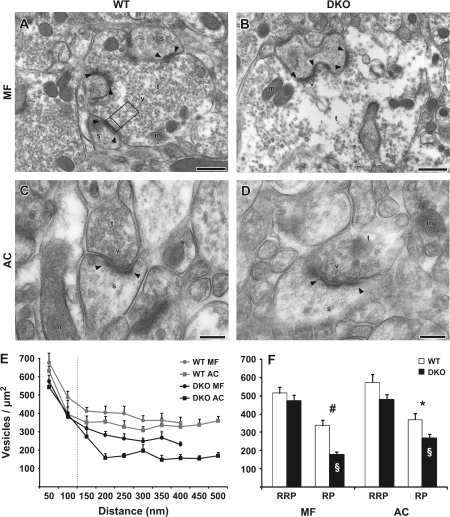
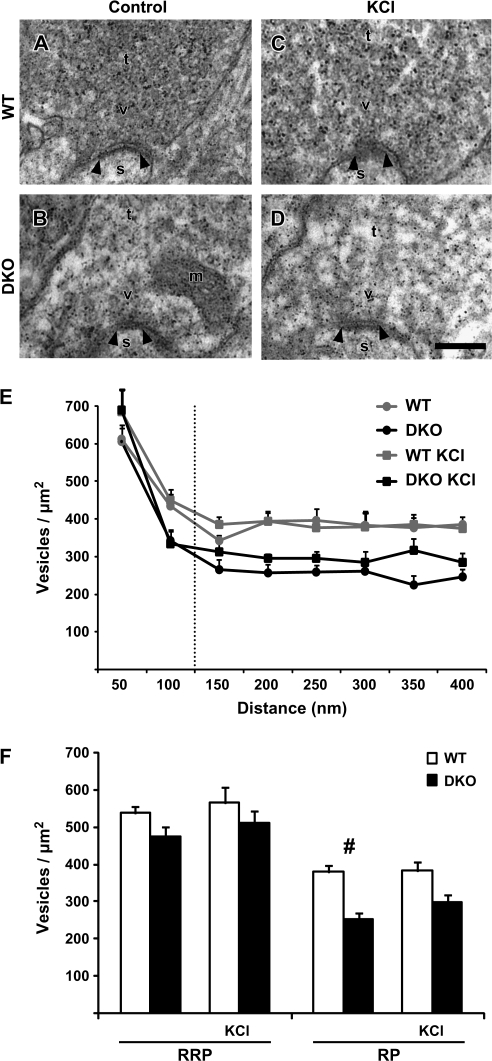
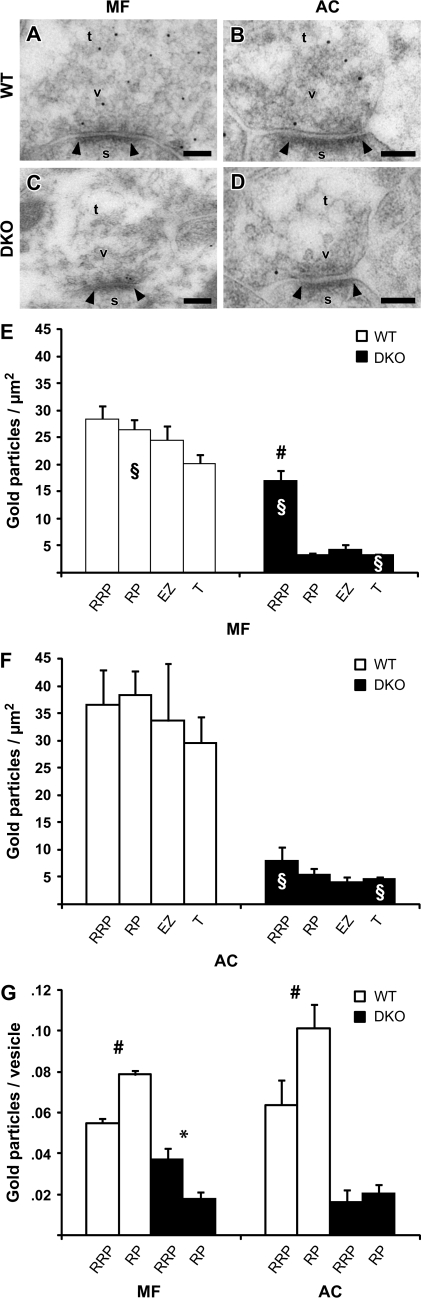
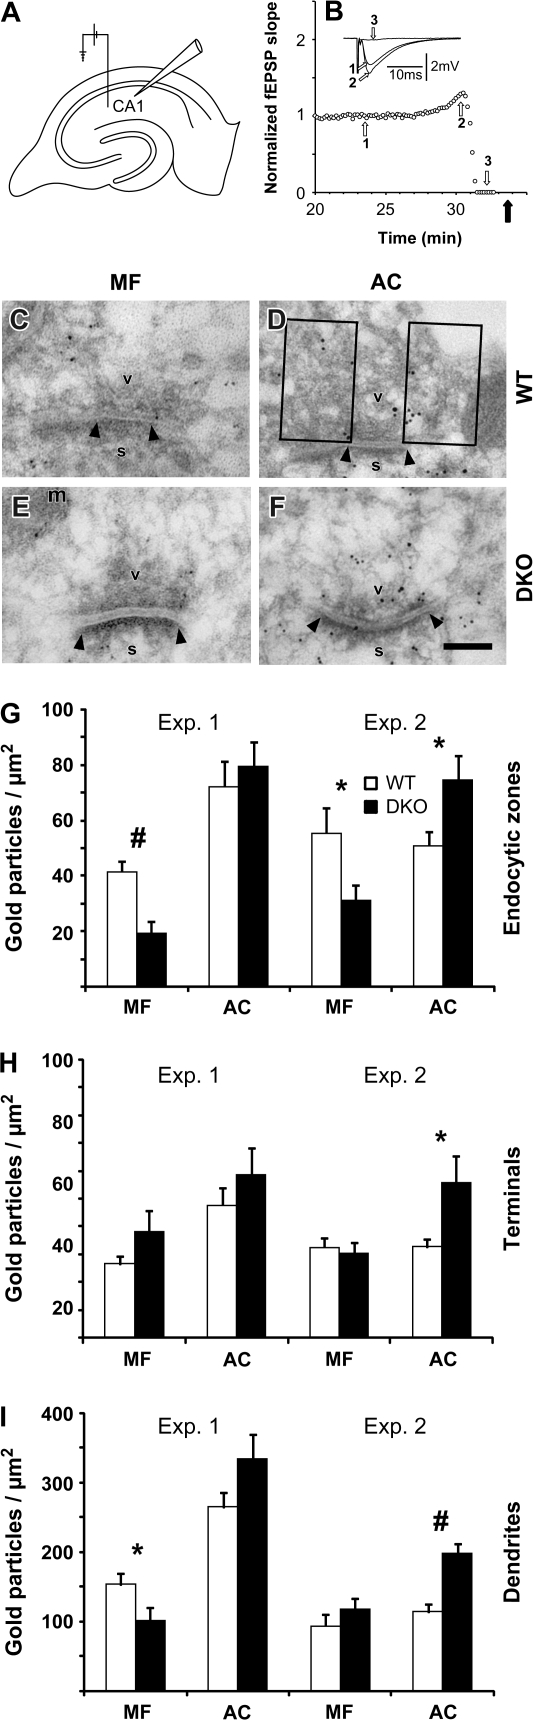
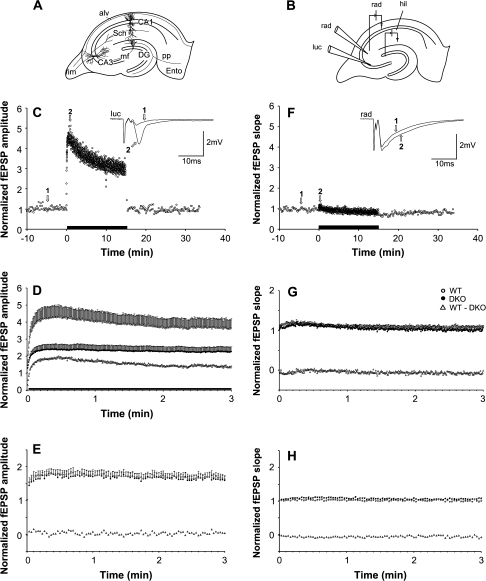
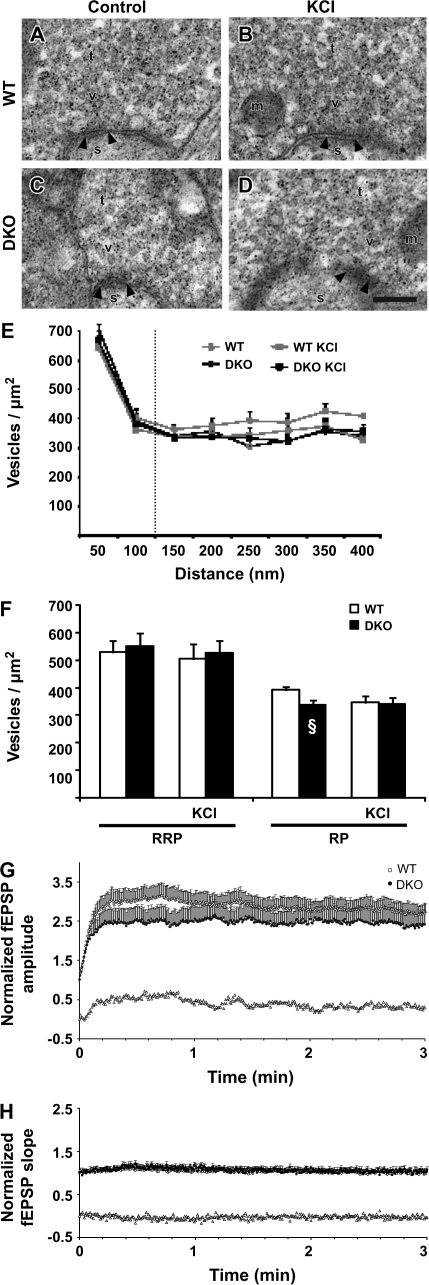
The synapsin proteins have different roles in excitatory and inhibitory synaptic terminals. We demonstrate a differential role between types of excitatory terminals. Structural and functional aspects of the hippocampal mossy fiber (MF) synapses were studied in wild-type (WT) mice and in synapsin double-knockout mice (DKO). A severe reduction in the number of synaptic vesicles situated more than 100 nm away from the presynaptic membrane active zone was found in the synapsin DKO animals. The ultrastructural level gave concomitant reduction in F-actin immunoreactivity observed at the periactive endocytic zone of the MF terminals. Frequency facilitation was normal in synapsin DKO mice at low firing rates (approximately 0.1 Hz) but was impaired at firing rates within the physiological range (approximately 2 Hz). Synapses made by associational/commissural fibers showed comparatively small frequency facilitation at the same frequencies. Synapsin-dependent facilitation in MF synapses of WT mice was attenuated by blocking F-actin polymerization with cytochalasin B in hippocampal slices. Synapsin III, selectively seen in MF synapses, is enriched specifically in the area adjacent to the synaptic cleft. This may underlie the ability of synapsin III to promote synaptic depression, contributing to the reduced frequency facilitation observed in the absence of synapsins I and II.


Figures

Figure 1.
Figure 1.
Vesicular densityin MF and AC terminals of synapsin WT and DKO mice. (A) Electron micrograph from the CA3 stratum lucidum in the hilus of the area dentata in a perfusion-fixed WT mouse. An MF terminal is marked (t), vesicles (v), mitochondria (m), spines (s) and postsynaptic densities (arrowheads). Opposite of one postsynaptic density, a frame is drawn to illustrate the lateral limits used for counting vesicles in a terminal. Also the distances 0, 100, and 500 nm are marked by lines, representing the categories RRPand RP presented in (F). Scale bar: 0.5 μm. (B) As in (A), but from a synapsin DKO mouse. Vesicular density appears normal close to the synaptic cleft, but severely reduced further away, when compared with (A). (C) Electron micrograph taken from the CA1 stratum radiatum layer. An AC terminal is marked as in (A) (without frame). Scale bar: 0.2 μm. (D) As in (C), but from a synapsin DKO mouse. The reduction in vesicle density appears less prominent than in B. (E) Vesicle densities (mean + standard error of the mean, vesicles/μm2, n = 5 mice) plotted against distance from the synapse in nanometer. Vesicles were grouped in bins of 50 nm and were recorded up to a maximum distance of 500 nm in MF and to 400 nm in AC due to the smaller overall size of AC terminals. The 2 traces from synapsin DKO mice are both below the WT traces. (F) As in (E), but results are grouped into distances of 0–100-nm distance and 0–400/500 nm, corresponding to RRP and RP, respectively. Symbols indicate differences between means that are statistically significantly different: #P = 0.001, *P < 0.04 between WT and DKO, §P < 0.01 between MF and AC. When nonparametric tests were performed, the same groups were statistically different, except between MF and AC (§) which was now at P = 0.056. All data are based on 20 electron micrographs (containing 20–46 synapses) from each of 5 perfusion-fixed mice (n = 5) per synapse type and genotype.
Figure 2.
Figure 2.
Vesicular density in stimulated and control MF terminals in synapsin WT and DKO mice. (A) Electron micrograph of a MF terminal (t) from a WT hippocampal slice preparation. A synapse is indicated by its postsynaptic density (arrowheads), spine (s), vesicles (v), and mitochondria (m). Scale bar: 0.1 μm. (B) As in (A), but the electron micrograph is from a synapsin DKO MF terminal. (C, D) As in (A) and (B), respectively, but the electron micrographs are from slices exposed to 30 mM [KCl]o. Artifactual small, electron-dense precipitates are present in electron micrographs (AD). (E) Vesicle densities (mean + standard error of the mean, vesicles/μm2, n = 3 mice) plotted against distance from the presynaptic membrane specialization in WT and synapsin DKO mice, either in control situation or exposed to high [KCl]o. Vesicles were grouped into bins of 50 nm and were recorded up to a maximum distance of 400 nm. (F) As in (E), but results are grouped into distances of 0- to 100-nm distance and 0–400 nm, corresponding to RRP and RP, respectively. Vesicle densities were compared between genotypes at the given distances (#P < 0.01). This could not be confirmed with a Mann–Whitney test because of the low n. For each condition, 3 WT and 3 synapsin DKO mice (n = 3) were analyzed and compared (20 electromicrographs containing 18–45 synapses were analyzed in each mouse).
Figure 3.
Figure 3.
Synapsin Ia/IIa/IIIa panspecific labeling in MF and AC terminals from perfusion-fixed WT and synapsin DKO mice. (A) Electron micrograph from a WT MF terminal immunolabeled with synapsin G304 antibodies. A synapse is indicated by its postsynaptic density (arrowheads), spine (s), and vesicles (v). Gold particles were quantified within an RRP and RP zone, morphologically defined according to distances from the presynaptic membrane, 0–100 nm and 100–400 nm, respectively, and laterally limited by a line drawn perpendicularly to the synaptic cleft (see Fig. 1). EZs were defined to be 150 × 250 nm lateral to the RRP or less for smaller synapses. Averages for whole terminals where also acquired (T). Scale bar: 0.1 μm. (B) As in (A), but the electron micrograph is from an AC terminal in a WT mouse. (C, D) As in (A) and (B), but the electron micrographs are from a synapsin DKO mouse. Notice that the only prominent labeling is in the RRP of MF, probably representing synapsin III. (E, F) Histograms showing a comparison between quantified data obtained from 5 WT and 5 DKO mice, in MF, (E), and AC, (F). In DKO, the RRP was significantly different from all other areas, and by several orders of magnitude, indicative of the presence of synapsin III. Also, this could explain the unexpectedly dense labeling in the WT RRP. (G) As in (E) and (F), but average gold particle density is combined with average vesicle density from Figure 1 to correct for error due to variations in vesicle density. In (E) and (F), labeling is artificially high in the RRP due to high vesicle density. Still, a difference between RRP and RP in DKO MF terminals can be seen. Twenty images where analyzed in each of 5 mice (n = 5) per genotype and type of synapse (containing 17–21 synapses). The columns represent mean + standard error of the mean of gold particles/μm2 in the specified areas and in the rest of the terminal (T). Densities were compared between the areas using an analysis of variance test with a Scheffe's post hoc test (#P < 0.01) and between DKO and WT using the t-test (§P < 0.04). A Kruskal–Wallis and Mann–Whitney tests gave similar results (P < 0.05).
Figure 4.
Figure 4.
F-actin labeling in AC and MF terminals in WT and synapsin DKO mice exposed to depolarizing [KCl]o. (A) Schematic drawing of a hippocampal slice with the electrode arrangements in stratum radiatum of the CA1 region. (B) The graph shows an example of the change in fEPSP slope as a function of time when a WT slice is incubated in high [KCl]o (40 mM). Afferent stimulation and synaptic recordings are as depicted in (A). The slopes of the elicited fEPSPs were normalized to the mean value obtained 1 min prior to the start of high [KCl]o wash-in (time zero), and the effects are presented from around 27 min and onward. Filled arrow indicates the time at which the slice was removed from the recording chamber and fixed. Inset: superimposed synaptic responses at times indicated by open arrows and numbers. (C) Electron micrograph from a MF terminal exposed to high [KCl]o in a hippocampal slice from a WT mouse. A synapse is indicated by its postsynaptic density (arrowheads), spine (s), vesicles (v), and mitochondria (m). Scale bar: 0.1 μm. (D) As in (C), but the electron micrograph is from an AC collateral terminal. Boxes represent the EZs analyzed (150 nm lateral to the active zone and 250 nm perpendicular to the active zone, unless further restricted by the size of the terminal). (E, F) As in (C) and (D), but from synapsin DKO mice. (G) Bar graph (mean + standard error of the mean) representing quantitative analyses of F-actin in EZs (gold particles/μm2). Two pairs of WT and synapsin DKO mice were analyzed independently and repeated once (experiments 1 and 2). Twenty electron micrographs (containing 25–33 synapses) were analyzed for each synapse type in each animal. Actin-labeling densities were compared between genotypes. A prominent reduction in DKO compared with WT was observed in MF EZ only, in both experiments (#P ≤ 0.002, *P ≤ 0.03). The nonparametric Mann–Whitney test gave similar results. (H) As in (G), but quantified in the whole terminal. No differences were observed in either experiment. (I) As in (G), but quantified in the dendrites postsynaptic to terminals in (G) and (H) (different scale due to a generally more dense labeling than in G and H). No differences were observed.
Figure 5.
Figure 5.
Frequency facilitation in the MF–CA3 and AC collateral–CA3 pathways. (A) Schematic drawing of the hippocampal slice with a simplified relevant excitatory network. Ento, entorhinal cortex; DG, dentate gyrus, pp, perforant path; fim, fimbria; alv, alveus; Sch, Schaffer collaterals (branches of AC collateral axons). (B) Schematic drawing showing electrode arrangement in the CA3 region. One recording electrode was placed extracellularly in stratum lucidum (luc), the other in stratum radiatum (rad) in order to monitor synaptic responses elicited by stimulation electrodes placed in the hilus (hil) and in the stratum radiatum for selective stimulation of MFs and AC collaterals, respectively. (C) Normalized fEPSP amplitude measurements during afferent stimulation of the MF in an experiment at 0.1 Hz in WT mice, followed by 2 Hz for 15 min (indicated by black bar along the abscissa), and reversal to 0.1 Hz. Inset shows the mean of 5 consecutive responses at times indicated by open arrows and numbers. (D) Normalized and pooled MF-elicited fEPSPs in WT (open circles) and synapsin DKO (filled circles) mice following the switch from 0.1- to 2-Hz stimulation (only the first 3 min are shown). Subtraction of the values obtained in synapsin DKO mice from those obtained in WT mice is represented by the open triangles. Vertical bars indicate standard error of the mean. Black horizontal bar along the abscissa indicates that the genotypes differ (P < 0.05). (E) As in (D), but following the switch from 0.1- to 0.5-Hz stimulation of the MF–CA3 pathway. (F) as in (C) and (G) and (H) as in (D) and (E), but measurements are from responses elicited by stimulation of the AC collateral–CA3 pathway.
Figure 6.
Figure 6.
Effects of F-actin modulation on vesicle densities and frequency facilitation at MF–CA3 synapses in slices. (A) Electron micrograph from a control WT MF terminal (t) exposed to cytochalasin B (20 μM). The synapse is indicated by its postsynaptic density (arrowheads), spine (s), vesicles (v), and mitochondria (m). Scale bar: 0.1 μm. (B) As in (A), but the electron micrograph is from a WT MF terminal which subsequently to cytochalasin B (20 μM) exposure was stimulated with 30 mM [KCl]o. (C, D) As in (A) and (B), but the electron micrographs are from synapsin DKO MF terminals. Artifactual small, electron-dense precipitates are present in electron micrographs (AD). (E) Bar graph (mean + standard error of the mean [SEM]) showing the vesicle densities (vesicles/μm2) at increasing distance from the presynaptic membrane specialization in both genotypes in control situation and exposed to high [KCl]o. (F) Bar graph results are grouped into distances of 0- to 100-nm distance and 0–400 nm, corresponding to RRP and RP, respectively. Vesicle densities were compared between genotypes at the given distances and no differences found. For each of the treatments, 3 WT and 3 synapsin DKO mice (the number of synapses in each animal ranged from 18 to 34 in 20 electron micrographs from each slice). Note the increase in DKO vesicle density, rather than a decrease in WT. §P < 0.05 between DKO with and without cytochalasin B when comparing Figure 2F. (G) Normalized and pooled MF-elicited fEPSPs in WT (open circles) and synapsin DKO (filled circles) mice following the switch from 0.1- to 2-Hz stimulation (only the first 3 min are shown) in the presence of cytochalasin B (20 μM). Subtraction of the values obtained in synapsin DKO mice from those obtained in WT mice is represented by the open triangles. Vertical bars indicate SEM. (H) As in (F), but measurements are from responses elicited by stimulation of the AC collateral–CA3 pathway in the presence of cytochalasin B (20 μM).

Similar articles

Cited by

References

    1. Acsady L, Kamondi A, Sik A, Freund T, Buzsaki G. GABAergic cells are the major postsynaptic targets of mossy fibers in the rat hippocampus. J Neurosci. 1998;18:3386–3403. - PMC - PubMed
    1. Ashton AC, Ushkaryov YA. Properties of synaptic vesicle pools in mature central nerve terminals. J Biol Chem. 2005;280:37278–37288. - PubMed
    1. Atwood HL, Karunanithi S. Diversification of synaptic strength: presynaptic elements. Nat Rev Neurosci. 2002;3:497–516. - PubMed
    1. Awizio AK, Onofri F, Benfenati F, Bonaccurso E. Influence of synapsin I on synaptic vesicles: an analysis by force-volume-mode of the atomic force microscope and dynamic light scattering. Biophys J. 2007;93:1051–1060. - PMC - PubMed
    1. Bahler M, Greengard P. Synapsin I bundles F-actin in a phosphorylation-dependent manner. Nature. 1987;326:704–707. - PubMed

Publication types