. 2008 Sep;19(9):1753-62.
doi: 10.1681/ASN.2007121360. Epub 2008 Jun 11.

A missense mutation in the sodium phosphate co-transporter Slc34a1 impairs phosphate homeostasis

Affiliations

A missense mutation in the sodium phosphate co-transporter Slc34a1 impairs phosphate homeostasis

Takayuki Iwaki et al. J Am Soc Nephrol. 2008 Sep.

Abstract

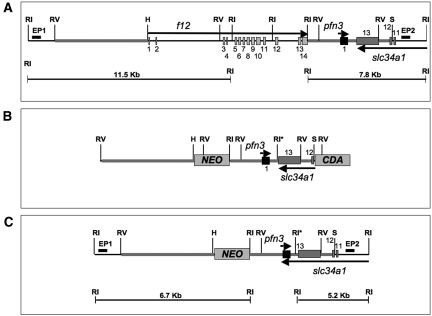
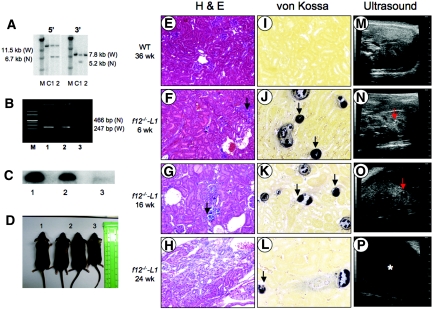
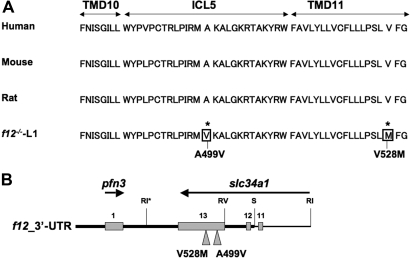
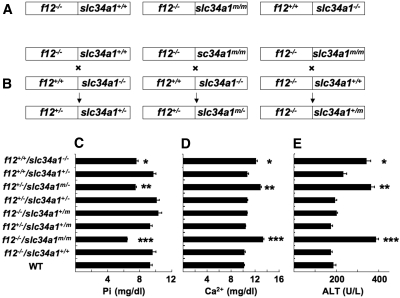
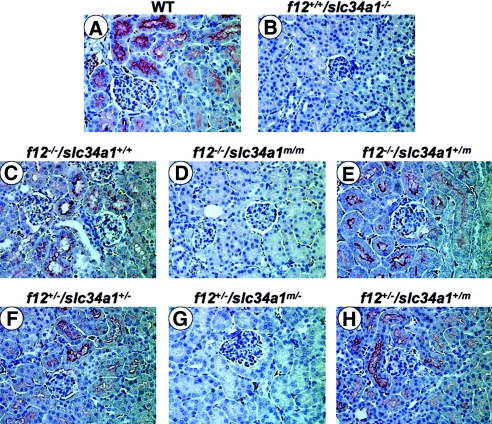
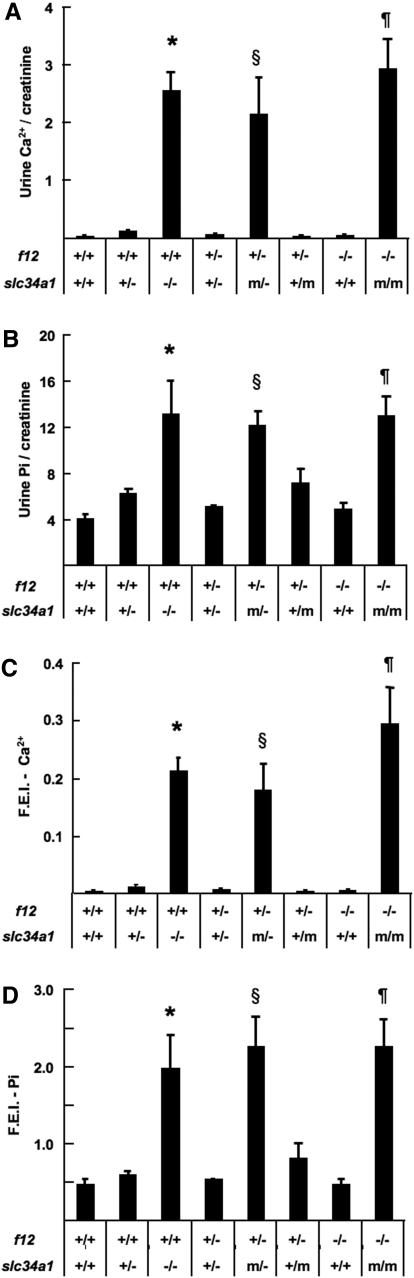
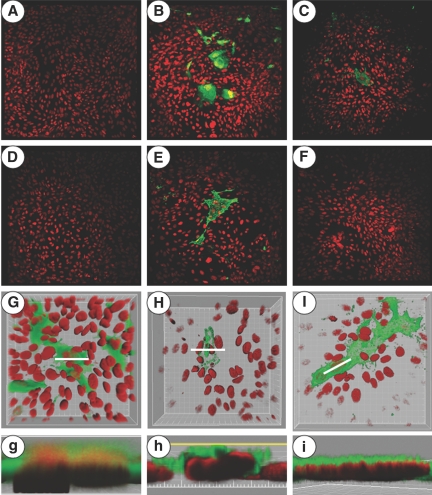
The sodium phosphate co-transporters Npt2a and Npt2c play important roles in the regulation of phosphate homeostasis. Slc34a1, the gene encoding Npt2a, resides downstream of the gene encoding coagulation factor XII (f12) and was inadvertently modified while generating f12(-/-) mice. In this report, the renal consequences of this modification are described. The combined single allelic mutant Slc34a1m contains two point mutations in exon 13: A499V is located in intracellular loop 5, and V528M is located in transmembrane domain 11. In addition to the expected coagulopathy of the f12(-/-) phenotype, mice homozygous for the double allelic modification (f12(-/-)/slc34a1(m/m)) displayed hypophosphatemia, hypercalcemia, elevated levels of alkaline phosphatase, urolithiasis, and hydronephrosis. Strategic cross-breedings demonstrated that the kidney-related pathology was associated only with autosomal recessive transmission of the slc34a1(m) gene and was not influenced by the simultaneous inactivation of f12. Npt2a[V528M] could be properly expressed in opossum kidney cells, but Npt2a[A499V] could not. These results suggest that a single amino acid substitution in Npt2a can lead to improper translocation of the protein to the cell membrane, disturbance of phosphate homeostasis, and renal calcification. Whether point mutations in the SLC34A1 gene can lead to hypophosphatemia and nephrolithiasis in humans remains unknown.


Figures

Figure 1.
Figure 1.
Generation of f12−/−-L1 mice. (A) The top line represents the f12 gene with its 14 exons (light gray boxes), the pfn3 gene with its one exon (black box), and exons 11 through 13 of the slc34a1 gene (dark gray boxes). Some key restriction enzyme sites are indicated (RI, EcoRI; RV, EcoRV; H, HindIII; S, SalI). (B) Construction of the TV for f12−/−-L1 mice. An RI-H digestion region of the 5′-UTR (A) and an RI-S digestion fragment of the 3′-UTR (A) of the f12 gene were used to flank the NEO cDNA, which was used for positive selection after homologous recombination in mouse embryonic stem cells. A cytidine deaminase (CDA) cassette was inserted downstream of the RI-S fragment and used for negative selection of recombinants. This process resulted in replacement of the entire f12 coding sequence with NEO. *One RI site was newly generated for purposes of screening. EP1 and EP2 in A represent external probes used for the 5′ and 3′ flanks of the TV, respectively. (C) Expected mutated allele.
Figure 2.
Figure 2.
Screening and characterization of f12−/−-L1 mice. (A) Southern blot analysis with the 5′- and 3′-external probes of digested DNA from ESC transfected with f12. The 5′ external probe (EP1 in Figure 1A) distinguished the WT-f12 (11.5 kb) and null (6.7 kb) alleles with RI-digested DNA, and the 3′ external probe (EP2 in Figure 1A) distinguished the WT-f12 (W; 7.8 kb) and null (N; 5.2 kb) alleles with RI-digested DNA. Molecular weight standards (M) are shown in lane 1; control 129/SvJ DNA (C) is shown in lane 2, and individual targeted ESC samples are enumerated in the remaining lanes. (B) PCR-based genotyping of typical WT (lane 2), f12+/−-L1 (lane 3) and f12−/−-L2 (lane 4) mouse tail-tip DNA. (C) Western blot analysis of typical WT (lane 1), f12+/−-L1 (lane 2), and f12−/−-L1 (lane 3) mouse plasmas, using a polyclonal antibody to human FXII, showing the absence of FXII antigen in f12−/−-L1 mouse plasma. (D) Body sizes of WT, f12+/−-L1, and f12−/−-L1 mice. (E) Hematoxylin II and eosin Y (H & E) stains for WT mouse kidney at 36 wk of age. (F through H) H & E stains of f12−/−-L1 mouse kidney at 6 wk of age (F), 16 wk of age (G), and 24 wk of age (H). The arrows in F and G indicate areas of kidney with abnormal cellularity, with widespread kidney architecture disruption in G. (I) von Kossa stains for WT mouse kidney at 36 wk of age and of f12−/−-L1 mouse kidneys at 6 wk of age (J), 16 wk of age (K), and 24 wk of age (L). The arrows point to examples of calcifications in J through L. Transabdominal ultrasound images for WT mouse kidney at 36 wk of age (M), f12−/−-L1 mouse kidney at 6 wk of age (N), 16 wk of age (O), and 24 wk of age (P). Red arrows in (N) and (O) indicate the high echogenic parts, which are typical indications of calcification. The arrow in N shows a calcification in a low echogenic cystic region of the kidney. An asterisk in (P) indicates a large area of low echogenicity, which is a typical signature of renal hydronephritis. Magnification, ×200.
Figure 3.
Figure 3.
Sequence analysis of the 3′-flanking region of f12−/−-L1. (A) Amino acid sequence comparisons of a region of the slc34a1 gene in humans and rodents with f12−/−-L1 mice, showing the two mutations (boxed) in the latter. TMD, transmembrane domain; ICL, intracellular loop. (B) The two point mutations (*) in exon 13 resulting from the recombination event in the 3′ genomic region of f12−/−-L1 mice are indicated and represented in slc34a1 in the bottom panel. This gene is oriented in the opposite direction of the f12 and pfn3 genes, and only exons 11, 12, and 13 (gray boxes) are shown because the 3′ flank of the TV does not extend beyond this region. The relative location of the pfn3 gene is also shown with its single exon (gray box).
Figure 4.
Figure 4.
A scheme of genotype variations and plasma chemistries of f12 and slc34a1 gene altered mice. (A) Genotypes of three different lines of f12/slc34a1 mice that were the starting points of the cross-breedings. (B) Genotypes of mice that were produced from the cross-breedings. (C through E) Serum Pi levels (C), serum Ca2+ levels (D), and serum ALP levels (E) of the various genotypic combinations of mice obtained from the cross-breedings. *The levels in f12+/+/slc34a1−/− sera were significantly different from those of WT, f12−/−/slc34a1+/+, f12+/−/slc34a1+/m, f12−/−/slc34a1+/m, f12+/−/slc34a1+/−, and f12+/+/slc34a1+/− sera but not significantly different from those of f12−/−/slc34a1m/m and f12+/−/slc34a1m/− sera. #The levels in f12+/−/slc34a1m/− were significantly different from those of WT, f12−/−/slc34a1+/+, f12+/−/slc34a1+/m, f12−/−/slc34a1+/m, f12+/−/slc34a1+/−, and f12+/+/slc34a1+/− sera, but not significantly different from those in f12+/+/slc34a1−/− and f12−/−/slc34a1m/m sera. †The levels in f12−/−/slc34a1m/m serum were significantly different from those in WT, f12−/−/slc34a1+/+, f12+/−/slc34a1+/m, f12−/−/slc34a1+/m, f12+/−/slc34a1+/−, and f12+/+/slc34a1+/− sera but not significantly different from those in f12+/+/slc34a1−/− and f12+/−/slc34a1m/− sera.
Figure 5.
Figure 5.
(A through H) Immunostains of Npt2a in WT (A), f12+/+/slc34a1−/− (B), f12−/−/slc34a1+/+ (C), f12−/−/slc34a1m/m (D), f12−/−/slc34a1+/m (E), f12+/−/slc34a1+/− (F), f12+/−/slc34a1m/−, (G) and f12+/−/slc34a1+/m (H) kidneys. Magnification, ×400.
Figure 6.
Figure 6.
Urinary analysis for Pi and Ca2+ excretion. (A) Urine Ca2+/creatinine. (B) Urine Pi/creatinine. (C) fractional excretion indexes (FEI) of Ca2+. (D) FEI of Pi. *The levels in f12+/+/slc34a1−/− were significantly different from those of WT, f12−/−/slc34a1+/+, f12+/−/slc34a1+/m, f12+/−/slc34a1+/−, and f12+/+/slc34a1+/− but not significantly different from those of f12−/−/slc34a1m/m and f12+/−/slc34a1m/−. §The levels in f12+/−/slc34a1m/− were significantly different from those of WT, f12−/−/slc34a1+/+, f12+/−/slc34a1+/m, f12+/−/slc34a1+/−, and f12+/+/slc34a1+/− but not significantly different from those in f12+/+/slc34a1−/− and f12−/−/slc34a1m/m. ¶The levels in f12−/−/slc34a1m/m were significantly different from those in WT, f12−/−/slc34a1+/+, f12+/−/slc34a1+/m, f12+/−/slc34a1+/−, and f12+/+/slc34a1+/−, but not significantly different from those in f12+/+/slc34a1−/− and f12+/−/slc34a1m/−.
Figure 7.
Figure 7.
Fluorescence and laser scanning confocal microscopy for transfected OK cells. (A through F) Immunostains of Npt2a in OK cells transfected with pCS2-empty plasmid (A), pCS2-GFP (B), pCS2-slc34a1 (C), pCS2-slc34a1[A499V] (D), pCS2-slc34a1[V528M] (E), and pCS2-slc34a1[A499/V528M] (F). (G through I) Immunostains of Npt2a in OK cells transfected with pCS2-GFP (G), pCS2-slc34a1 (H), and pCS2-slc34a1[V528M] (I) using an oil immersion objective. (g through i) Cross-sections along the planes from G through I represented by white lines, respectively. Clipping planes were placed at the regions of interest, which are indicated as white lines in G through I, and used to expose the GFP-positive (g) or NPT2 Alexa Fluor 488–positive (h and i) labeling and its cellular localization. The images were rendered to 120° perspective projection and captured at a zoom factor of 0.857 pixel/voxel. XY and XZ orthogonal images were captured. Magnifications: ×20 in A through F; ×60 in G through I.

Comment in

References

    1. Forster IC, Kohler K, Biber J, Murer H: Forging the link between structure and function of electrogenic cotransporters: The renal type IIa Na+/Pi cotransporter as a case study. Prog Biophys Mol Biol 80: 69–108, 2002 - PubMed
    1. Murer H, Forster I, Biber J: The sodium phosphate cotransporter family SLC34. Pflugers Arch 447: 763–767, 2004 - PubMed
    1. Forster IC, Hernando N, Biber J, Murer H: Proximal tubular handling of phosphate: A molecular perspective. Kidney Int 70: 1548–1559, 2006 - PubMed
    1. Tenenhouse HS: Phosphate transport: Molecular basis, regulation and pathophysiology. J Steroid Biochem Mol Biol 103: 572–577, 2007 - PubMed
    1. Shimada T, Hasegawa H, Yamazaki Y, Muto T, Hino R, Takeuchi Y, Fujita T, Nakahara K, Fukumoto S, Yamashita T: FGF-23 is a potent regulator of vitamin D metabolism and phosphate homeostasis. J Bone Miner Res 19: 429–435, 2004 - PubMed

Publication types

MeSH terms