. 2008 Jun 11;28(24):6104-10.
doi: 10.1523/JNEUROSCI.0437-08.2008.

Cell type-specific firing during ripple oscillations in the hippocampal formation of humans

Affiliations

Cell type-specific firing during ripple oscillations in the hippocampal formation of humans

Michel Le Van Quyen et al. J Neurosci. .

Abstract

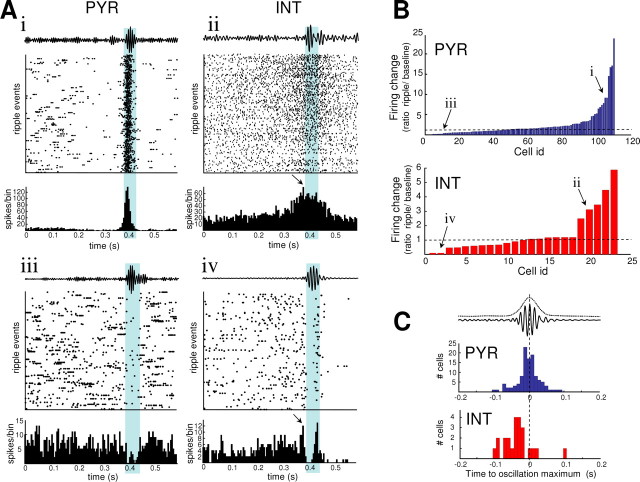
High-frequency field ripples occur in the rodent hippocampal formation and are assumed to depend on interneuron type-specific firing patterns, structuring the activity of pyramidal cells. Ripples with similar characteristics are also present in humans, yet their underlying cellular correlates are still unknown. By in vivo recording interneurons and pyramidal cells in the human hippocampal formation, we find that cell type-specific firing patterns and phase-locking on a millisecond timescale can be distinguished during ripples. In particular, pyramidal cells fired preferentially at the highest amplitude of the ripple, but interneurons began to discharge earlier than pyramidal cells. Furthermore, a large fraction of cells were phase-locked to the ripple cycle, but the preferred phase of discharge of interneurons followed the maximum discharge probability of pyramidal neurons. These relationships between human ripples and unit activity are qualitatively similar to that observed in vivo in the rodents, suggesting that their underlying mechanisms are similar.


Figures

Figure 1.
Figure 1.
A, Single-field ripple event (black trace) detected in the hippocampus by bandpass filtering (red trace) or by the time–frequency representation (top). The power of the oscillation is depicted by a color scale coded in SDs above the mean power of an event-free baseline. The expanded trace (bottom panel) shows unit activities (Δ) during the oscillations, mostly occurring around the negative peak of ripple cycle. B, Physiological identification of putative pyramidal cells (PYR; blue) and interneurons (INT; red). The spike width (right), measured as the average time between the peak and the trough of the action potential, shows a characteristic difference between pyramidal cell and interneuron. The dotted lines indicate times of peak and trough for each cell. In addition, the autocorrelogram (left) of the spike time also shows that putative pyramidal cells have a peak at 3–5 ms followed by a rapid exponential decay, whereas interneurons exhibited a much slower decay. C, Top, First moment (i.e., the mean value) of the autocorrelogram as a function of spike width for interneurons (red) and pyramidal cells (blue). Bottom, Histogram of the spike width distribution.
Figure 2.
Figure 2.
A, Ripple-triggered spike histograms (bin size, 5 ms). Cells i and iii (ii and iv, respectively) are putative pyramidal cells (interneurons, respectively). Note that, for interneurons ii and iv, the maximal neuronal discharge (arrows) occurs before the field ripples. B, Firing changes of interneurons (INT; red) and pyramidal cells (PYR; blue) during ripples, defined as the ratio between the discharge probability during ripples and baseline. C, Temporal relationship between the maximal neuronal discharge (red, interneurons; blue, pyramidal cells) and the highest peak of the oscillation envelope (dotted line).
Figure 3.
Figure 3.
A, Phase-locking of spikes relative to the field ripple cycle (color panel; green contour line, p < 0.01; blue contour line, p < 0.001) for an interneuron (INT; bottom) and pyramidal cell (PYR; top). “x” indicates the frequency where phase locking is most statistically significant. The phase-locking of the cells is also confirmed by the spike-triggered field average (top black curve; average of 100 spikes), showing a strong high-frequency component of the averaged field. B, Phase distribution of the spikes of the two cells illustrated in A (for the frequency indicated by “x” in A). Phase zero marks the trough of the ripple cycles. The distributions were fitted with a von Mises function (continuous black lines), and its mean gives the preferred firing phase (arrows). C, Cumulative histogram of preferred firing phase for pyramidal cells (blue) and interneurons (red).

References

    1. Behrens CJ, van den Boom LP, de Hoz L, Friedman A, Heinemann U. Induction of sharp wave-ripple complexes in vitro and reorganization of hippocampal networks. Nat Neurosci. 2005;8:1560–1567. - PubMed
    1. Bragin A, Engel J, Wilson CL, Fried I, Buzsáki G. High-frequency oscillations in human brain. Hippocampus. 1999;9:137–142. - PubMed
    1. Bragin A, Wilson CL, Engel J. Chronic epileptogenesis requires development of a network of pathologically interconnected neuron clusters: a hypothesis. Epilepsia. 2000;41S:144–152. - PubMed
    1. Bragin A, Wilson CL, Staba RJ, Reddick M, Fried I, Engel J. Interictal high-frequency oscillations (80–500 Hz) in the human epileptic brain: entorhinal cortex. Ann Neurol. 2002a;52:407–415. - PubMed
    1. Bragin A, Mody I, Wilson C, Engel J. Local generation of fast ripples in epileptic brain. J Neurosci. 2002b;22:2012–2021. - PMC - PubMed

Publication types

LinkOut - more resources