. 2008 Sep;18(9):1403-14.
doi: 10.1101/gr.076455.108. Epub 2008 Jun 11.

CpG dinucleotides and the mutation rate of non-CpG DNA

Affiliations

CpG dinucleotides and the mutation rate of non-CpG DNA

Jean-Claude Walser et al. Genome Res. 2008 Sep.

Abstract

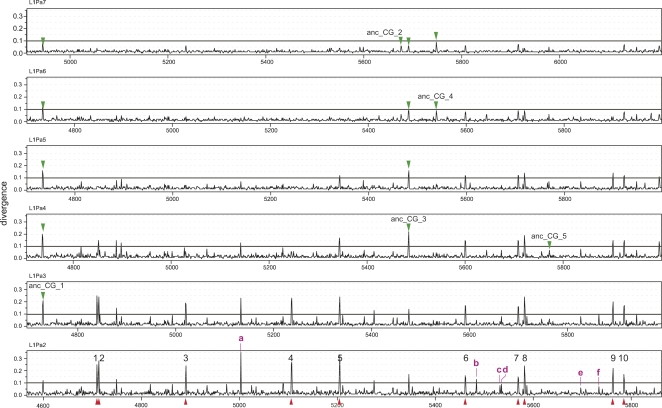
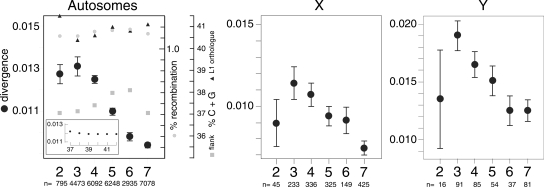
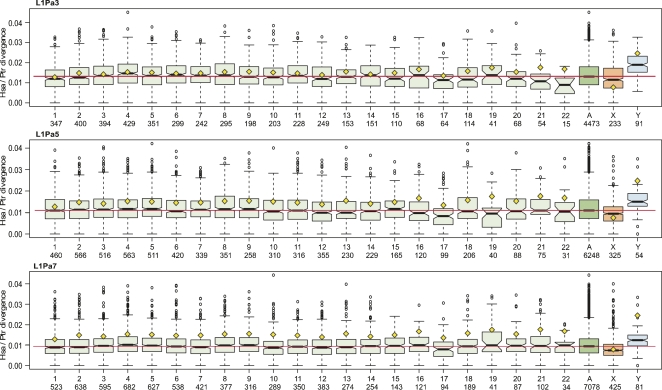
The neutral mutation rate is equal to the base substitution rate when the latter is not affected by natural selection. Differences between these rates may reveal that factors such as natural selection, linkage, or a mutator locus are affecting a given sequence. We examined the neutral base substitution rate by measuring the sequence divergence of approximately 30,000 pairs of inactive orthologous L1 retrotransposon sequences interspersed throughout the human and chimpanzee genomes. In contrast to other studies, we related ortholog divergence to the time (age) that the L1 sequences resided in the genome prior to the chimpanzee and human speciation. As expected, the younger orthologs contained more hypermutable CpGs than the older ones because of their conversion to TpGs (and CpAs). Consequently, the younger orthologs accumulated more CpG mutations than the older ones during the approximately 5 million years since the human and chimpanzee lineages separated. But during this same time, the younger orthologs also accumulated more non-CpG mutations than the older ones. In fact, non-CpG and CpG mutations showed an almost perfect (R2 = 0.98) correlation for approximately 97% of the ortholog pairs. The correlation is independent of G + C content, recombination rate, and chromosomal location. Therefore, it likely reflects an intrinsic effect of CpGs, or mutations thereof, on non-CpG DNA rather than the joint manifestation of the chromosomal environment. The CpG effect is not uniform for all regions of non-CpG DNA. Therefore, the mutation rate of non-CpG DNA is contingent to varying extents on local CpG content. Aside from their implications for mutational mechanisms, these results indicate that a precise determination of a uniform genome-wide neutral mutation rate may not be attainable.


Figures

Figure 1.
Figure 1.
The relationship between the age of L1 families and the phylogeny of humans, chimpanzees, and macaques. The age range of the six different L1 families (gray rectangles) was estimated from their divergence relative to the divergence time of humans (H), chimpanzees (P), and macaques (M) as described in the Methods. The extended limb of the gray rectangle for the L1Pa2 family indicates that this L1 family is still active in chimpanzees but went extinct in humans sometime after the chimpanzee/human divergence. The 4–7 Myr range of the estimate for this divergence (see Methods) is shown on the phylogenetic tree. (Double-headed arrows, T2–T7) Times between the mean age of each L1 family and the mean of the time of the chimpanzee/human divergence (see Methods). (Red arrow, Tall) Time from the mean of the chimpanzee/human divergence to the present. The divergences between the chimpanzee and human ortholog pairs include only the nucleotide changes that occurred during the Tall interval.
Figure 2.
Figure 2.
Relative percentage of CpG and TpG (CpA) at corresponding nucleotide positions of various L1 families. This determination was made on full-length members aligned as described in the Methods. The ordinate gives the relative percentage of CpG and (TpG + CpA) in full-length members of the various L1 families at positions corresponding to a CpG in the relevant L1 family-specific ancestral consensus sequence. The sums of the [CpG + (TpG + CpA)] percentages range from ∼83% in the three oldest families (L1Pa5–L1Pa7) to ∼92% in the three younger families (L1Pa2–L1Pa4). Also see Supplemental Table S9.
Figure 3.
Figure 3.
Divergence of L1 orthologs at single base pair resolution. The region shown corresponds to the 3′ 1200 bp of ORF2. The ordinate gives the fraction of the number of changes between the chimpanzee/human orthologs at each position. (Red triangles) CpGs present in L1Pa2, (lettered inverted green arrowheads) ancestral CpGs (ancCG_1, ancCG_2, etc.), (magenta lettered peaks) some non-CpG hot spots; only hotspot “d” corresponds to a CpT dinucleotide in L1Pa2 and L1Pa3 (see text). CpG hot spots are defined as a divergence >0.1 (solid line), and non-CpG hot spots as divergence >0.05. Also note that some CpG hot spots in the younger families persist as hot spots in the older families even after the frequency of CpGs in the older orthologs has fallen below the threshold value to appear as a CpG in the current consensus sequence (see Methods for definition of current and ancestral consensus sequences). An example of the data underlying this plot is shown for the 3′ 186 bp in Supplemental Figure S7.
Figure 4.
Figure 4.
Divergence of autosomal and sex chromosomal members of different L1 families. The median (black circles) and confidence intervals around the median (Strelen 2004) of the non-CpG ortholog divergences for the L1Pa2–L1Pa7 families were determined as described in the Methods. The means of the recombination rates (gray circles) are shown for each L1 family (see Methods). Mean % G + C content for the human orthologs (filled triangles) and their flanking DNA from Table 2 (gray squares) are also given. The number (n) of ortholog pairs for each L1 family (2–7) is shown for the data used for the divergence measurements. We were able to assign recombination rates to ≥98% of the L1 orthologs. (Inset) Portion of the curve fit extracted from Figure 4 published by (Hellmann et al. 2005). The Y-axis shows the divergence between syntenic regions of the chimpanzee and human genomes as a function of G + C content (X-axis).
Figure 5.
Figure 5.
The relationship between the percentage of non-CpG and CpG mutations. Both classes of mutations for the L1 orthologs were determined as described in the Methods. We calculated the correlation coefficient both with (dashed line) and without (solid line) the L1Pa2 orthologs because the orthologs for this family were recovered at a far lower frequency than the older families (see text). As a result they provided only ∼3% as much DNA sequence (in Mb) of the total base pairs in our data set. The reduced data set for the L1Pa2 family could partly explain why the relationship between CpG content and divergence of this family is different from that expected from the other families. It may also explain why the divergences of the L1Pa2 orthologs differed far more between the chromosomes than that of the other families (Supplemental Fig. S6).
Figure 6.
Figure 6.
Box blots of the distribution of chromosomal divergence values. The median divergence with a 95% confidence interval (notches) is given for the chimpanzee/human orthologs from the L1Pa3, L1Pa5, and L1Pa7 families. The number below each chromosome is the number of ortholog pairs compared. (A) Combined divergence for all the autosomes, (red line) median value of this divergence, (open circles) indicate outliers. (Box plots for all of the families are shown in Supplemental Fig. S6). (Yellow diamonds) Median value of whole-genome chromosomal divergences between syntenic regions of the chimpanzee and human genomes from Figure 1b in reference The Chimpanzee Sequencing and Analysis Consortium (2005).

References

    1. Adey N.B., Tollefsbol T.O., Sparks A.B., Edgell M.H., Hutchison C.A.I., Tollefsbol T.O., Sparks A.B., Edgell M.H., Hutchison C.A.I., Sparks A.B., Edgell M.H., Hutchison C.A.I., Edgell M.H., Hutchison C.A.I., Hutchison C.A.I. Molecular resurrection of an extinct ancestral promoter for mouse L1. Proc. Natl. Acad. Sci. 1994;91:1569–1573. - PMC - PubMed
    1. Asthana S., Schmidt S., Sunyaev S., Schmidt S., Sunyaev S., Sunyaev S. A limited role for balancing selection. Trends Genet. 2005;21:30–32. - PubMed
    1. Bird A.P. DNA methylation and the frequency of CpG in animal DNA. Nucleic Acids Res. 1980;8:1499–1504. - PMC - PubMed
    1. Bird A. DNA methylation patterns and epigenetic memory. Genes & Dev. 2002;16:6–21. - PubMed
    1. Bohossian H.B., Skaletsky H., Page D.C., Skaletsky H., Page D.C., Page D.C. Unexpected similar rates of nucleotide substitution found in male and female hominids. Nature. 2000;406:622–625. - PubMed

Publication types