. 2008 Jul;18(7):1073-83.
doi: 10.1101/gr.078261.108. Epub 2008 Jun 12.

A barrier nucleosome model for statistical positioning of nucleosomes throughout the yeast genome

Affiliations

A barrier nucleosome model for statistical positioning of nucleosomes throughout the yeast genome

Travis N Mavrich et al. Genome Res. 2008 Jul.

Abstract

Most nucleosomes are well-organized at the 5' ends of S. cerevisiae genes where "-1" and "+1" nucleosomes bracket a nucleosome-free promoter region (NFR). How nucleosomal organization is specified by the genome is less clear. Here we establish and inter-relate rules governing genomic nucleosome organization by sequencing DNA from more than one million immunopurified S. cerevisiae nucleosomes (displayed at http://atlas.bx.psu.edu/). Evidence is presented that the organization of nucleosomes throughout genes is largely a consequence of statistical packing principles. The genomic sequence specifies the location of the -1 and +1 nucleosomes. The +1 nucleosome forms a barrier against which nucleosomes are packed, resulting in uniform positioning, which decays at farther distances from the barrier. We present evidence for a novel 3' NFR that is present at >95% of all genes. 3' NFRs may be important for transcription termination and anti-sense initiation. We present a high-resolution genome-wide map of TFIIB locations that implicates 3' NFRs in gene looping.


Figures
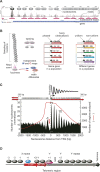
Figure 1.
Figure 1.
Nucleosome organization around the 5′ end of genes. (A) Browser shot showing the distribution of sequencing reads along 2.5 kb of an arbitrary gene (5′ end of YAL041W shown in blue). The read count at each coordinate is shown as a bar graph. The distribution was smoothed using a correction factor for MNase bias. Peaks correspond to assigned nucleosome locations based upon a user-defined threshold (purple tracks). Nucleosomes that are found in broad peaks or plateaus are assigned a specific location, although their actual position is delocalized (illustrated by overlapping ovals). Additional browser shots are shown in Supplemental Figure S3 and for any queried locus at http://atlas.bx.psu.edu/. (B) Illustration of the physical properties associated with nucleosome positions, which are defined in Table 1. (C) Distribution of nucleosome locations relative to transcriptional start sites (TSS) (David et al. 2006). Nucleosome distances were binned and the count divided by 100, then normalized to the number of regions (red line) present in each bin, and plotted as a smoothed distribution (black-filled plot). In an effort to represent a “pure” pattern, regions <300 bp from an adjacent TSS or TTS (transcript termination site) but also >300 bp from the reference TSS, were removed from the analysis. The same plot was generated without these filters (gray-filled plot, in background). An illustration of the statistical distribution of nucleosomes reported by Kornberg and Stryer (1988) is shown at the top of the panel. (D) Schematic illustration of nucleosome organization at telomeric regions. The arrangement of repeat elements is not representative of all telomeres, but represents a common arrangement. Positions of nucleosomes are approximate and reflect general themes, such as nucleosome-free zones, and noteworthy nucleosomes (colored blue, or bound by another protein in pink).
Figure 2.
Figure 2.
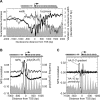
Statistical positioning emanating from barrier nucleosomes. (A) Nucleosome fuzziness and width relative to the TSS. Fuzziness (standard deviation of read locations for those nucleosomes defined by three or more reads) is plotted, against a gray backdrop of Figure 1C. Data are plotted as a moving average of 500 nucleosomes. Deviations from the canonical 147 bp nucleosomal length (in bp) are displayed as a 2000-nucleosome moving average, and represent the distance between the nucleosomal calls made separately on the W and C strand. (B) Averaged NPS correlation score and poly(dA:dT) density for genes aligned by the TSS. The NPS correlation employed an updated AA/TT nucleosomal distribution pattern (Supplemental Fig. S6C). Plot of AAAA/TTTT per bp frequency (11 bp moving average) is shown. Longer poly(dA:dT) tracts gave similar results (data not shown). The gray backdrop reflects nucleosome positions from Figure 1C. NPS scores and fuzziness are not correlated (Supplemental Fig. S7), indicating that the diminishing NPS correlation at distances distal to the −1/+1 nucleosome is unlikely to cause the increased fuzziness shown in panel A. (C) NPS correlation profiles broken out by AA dinucleotide enrichment near 5′ ends vs. 10 bp periodic spacing of AA dinucleotides.
Figure 3.
Figure 3.
Dinucleotides and cis-regulatory elements linked to nucleosome positioning. (A) “TA” dinucleotide distribution across three classes of nucleosomal DNA. From left to right: plots are for −1, +1, and all other genic nucleosomes. To maintain directionality relative to the TSS, only the transcribed strand was compiled. This and the remaining dinucleotide plots are presented in Supplemental Fig. S8. The Y-axis is scaled such that the ratio of the upper and lower range are the same in all plots, allowing them to be compared directly. (B) Enrichment of cis-regulatory elements at +1 nucleosomes having low NPS scores. See Methods for definition of strong (S) and weak (W) NPS scores. (C) Examples of cis-regulatory elements that are enriched at +1 nucleosomes having weak NPS scores.
Figure 4.
Figure 4.
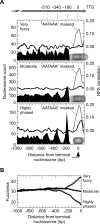
Statistical positioning emanating from positioned terminal nucleosomes. (A) Distribution of nucleosomes upstream of the terminal nucleosome. The terminal nucleosome was defined as the closest upstream nucleosome to the transcript termination site (TTS) (David et al. 2006) for transcripts of at least 1.3 kb. Terminal nucleosomes that were within 500 bp of the TTS and defined by >6 reads (to achieve a statistically robust fuzziness value) were divided into three groups based upon percent rank of fuzziness (<15%, highly phased; 15%–85%, moderate; >85%, very fuzzy). Upstream nucleosomes were binned based upon distance from the terminal nucleosome. Bin counts (left axis) were not normalized to the number of genes analyzed. NPS correlation plots for the same set of genes aligned by the terminal nucleosome are shown as solid traces (right axis). Dashed traces have AATAAA (and related sequences) masked, as described in the Methods. (B) Sliding window analysis of average nucleosome fuzziness as a function of distance from the terminal nucleosome. The low fuzziness around the penultimate nucleosome (from 150 to 250 bp upstream of the terminal nucleosome) was significant at 1 SD but not at 2 SD.
Figure 5.
Figure 5.
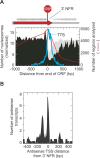
Distribution of nucleosomes and anti-sense TSS around 3′ end of genes. (A) Distribution of nucleosome locations relative to the 3′ end of open reading frames (ORFs). Nucleosome distances relative to the ORF stop codon were binned in 10 bp intervals, normalized to the number of regions represented in each bin (red line), then smoothed using a three-bin moving average. Regions internal to adjacent genes or within 360 bp of another ORF start site (whichever is closer) were either removed (black fill) or not removed (gray fill) from the analysis. The distribution of polyA sites, where transcripts terminate (TTS), is shown as a blue trace. (B) Distribution of anti-sense TSS distances from 3′ NFRs. Anti-sense TSS coordinates were from (Perocchi et al. 2007). Distances were binned (10 bp bin) and smoothed (three-bin moving average).
Figure 6.
Figure 6.
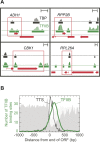
Distribution of TFIIB around 3′ end of genes. (A) High-resolution mapping of TFIIB at genomic loci. The genome-wide location of TFIIB (Sua7) and TBP were determined by ChIP-chip using high density Affymetrix tiling arrays (5 bp average probe spacing, 3.2 million probes). Results for four potentially looped genes are shown (boxed in red). Vertical bars reflect binding strength (TFIIB in green; TBP in black), and horizontal bars represent binding locations. Scales in upper right corner of each box represent 500 bp. (B) Composite distribution of TFIIB at the end of genes. Plots of nucleosomes (gray backdrop), TTS (black trace), and TFIIB (green trace) are shown.
Figure 7.
Figure 7.
Model depicting various contributors to nucleosome organization in the S. cerevisiae genome. Yellow and green mirrored triangles represent increased AA and TT dinucleotide enrichment toward the 5′ and 3′ ends of nucleosomal DNA, respectively. Their 10-bp periodical placement would rotationally phase the DNA on the nucleosomal surface, although rotational phasing may contribute modestly to translational positioning (Tanaka et al. 1992; Lee et al. 2007). The red half-ellipse represents the distribution of poly(dA:dT) tracts that exclude nucleosomes from the promoter. Black vertical bars represent AT and TA dinucleotide enrichment at nucleosome borders, which might contribute to translational positioning. The contributions of all A/T dinucleotides are diminished beyond the +1 nucleosome, in which statistical phasing takes over and decays toward the 3′ end of the gene (represented as fuzzier nucleosome ovals in gray). AA/TT positioning at the 3′ end of genes is depicted as being antagonized by AATAAA-related cleavage and polyadenylation signals. Transcription factors (TF) are shown to contribute to −1 and +1 positioning. TFIIB-linked looping (B) is shown.

References

    1. Albert I., Mavrich T.N., Tomsho L.P., Qi J., Zanton S.J., Schuster S.C., Pugh B.F. Translational and rotational settings of H2A.Z nucleosomes across the Saccharomyces cerevisiae genome. Nature. 2007;446:572–576. - PubMed
    1. Alen C., Kent N.A., Jones H.S., O'Sullivan J., Aranda A., Proudfoot N.J. A role for chromatin remodeling in transcriptional termination by RNA polymerase II. Mol. Cell. 2002;10:1441–1452. - PubMed
    1. Anderson J.D., Widom J. Poly(dA-dT) promoter elements increase the equilibrium accessibility of nucleosomal DNA target sites. Mol. Cell. Biol. 2001;21:3830–3839. - PMC - PubMed
    1. Bao Y., White C.L., Luger K. Nucleosome core particles containing a poly(dA⋅dT) sequence element exhibit a locally distorted DNA structure. J. Mol. Biol. 2006;361:617–624. - PubMed
    1. Basehoar A.D., Zanton S.J., Pugh B.F. Identification and distinct regulation of yeast TATA box-containing genes. Cell. 2004;116:699–709. - PubMed

Publication types

MeSH terms

LinkOut - more resources