Comparative Study
. 2008 Jul;95(1):426-34.
doi: 10.1529/biophysj.108.129999.

Comparing proteins by their unfolding pattern

Affiliations
Comparative Study

Comparing proteins by their unfolding pattern

Elias M Puchner et al. Biophys J. 2008 Jul.

Abstract

Single molecule force spectroscopy has evolved into an important and extremely powerful technique for investigating the folding potentials of biomolecules. Mechanical tension is applied to individual molecules, and the subsequent, often stepwise unfolding is recorded in force extension traces. However, because the energy barriers of the folding potentials are often close to the thermal energy, both the extensions and the forces at which these barriers are overcome are subject to marked fluctuations. Therefore, force extension traces are an inadequate representation despite widespread use particularly when large populations of proteins need to be compared and analyzed. We show in this article that contour length, which is independent of fluctuations and alterable experimental parameters, is a more appropriate variable than extension. By transforming force extension traces into contour length space, histograms are obtained that directly represent the energy barriers. In contrast to force extension traces, such barrier position histograms can be averaged to investigate details of the unfolding potential. The cross-superposition of barrier position histograms allows us to detect and visualize the order of unfolding events. We show with this approach that in contrast to the sequential unfolding of bacteriorhodopsin, two main steps in the unfolding of the enzyme titin kinase are independent of each other. The potential of this new method for accurate and automated analysis of force spectroscopy data and for novel automated screening techniques is shown with bacteriorhodopsin and with protein constructs containing GFP and titin kinase.


Figures

FIGURE 1
FIGURE 1
Transformation of force spectroscopy data from extension space into contour length space. The left side illustrates an AFM experiment. During retraction of the cantilever, the force and the extension are recorded. In the beginning, the unfolded part of the molecule is stretched and the force increases until the energy barrier is overcome by thermal fluctuations. Further stretching results again in a rise of force (dark gray). The rupture force and position differs from trace to trace due to fluctuations and may change on altered experimental conditions. The transformation of each data point from extension to contour length space and the accumulation in a histogram is shown on the right side. The representation with respect to this molecular coordinate does not exhibit the variances of the extension, but directly characterizes the energy barriers of the folding potential. Details that are lost by fitting, are still conserved with this approach.
FIGURE 2
FIGURE 2
Transformation of force spectroscopy data into barrier position histograms. (a) Force extension trace of the Ig-GFP protein construct. Cleary visible is the sawtooth pattern caused by unfolding of hAGT, GFP, and IG-domains. (b) Transformed trace. The transformation of each point was done with the WLC model and a persistence length of 0.4 nm. (c) Barrier position histogram. All points above the noise level of 10 pN were accumulated in a area-normalized histogram with a bin width of 1 nm. The coordinate of this representation is independent of fluctuations, and the energy barriers can be directly determined.
FIGURE 3
FIGURE 3
Comparison of different models for polymer elasticity. (a) Fraction of a force extension trace. (b) Three energy barrier histograms obtained by transforming trace (a) with the WLC model (p = 0.4 nm), the QM-WLC model and the FRC model (γ = 22°, b = 0.4 nm). The best result is achieved with the FRC, which produces the highest and sharpest peaks (compare Table 1). (c) Fraction of a force extension trace showing a small step at high forces. (d) Three energy barrier histograms of trace (c) with the same parameters as in (b). In contrast to the WLC, the QM-WLC and FRC models are able to resolve the small substep of 5 nm at 500 pN.
FIGURE 4
FIGURE 4
Averaging of barrier position histograms. (a) Superposition of 13 BR force extension traces. (b) The transformation into contour length space was accomplished with the WLC model and a persistence length of 0.4 nm. (c) The averaged barrier position histogram is obtained by averaging each peak of the 13 barrier position histograms. The threshold force was set to 60 pN and the bin width amounts to 0.36 nm.
FIGURE 5
FIGURE 5
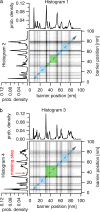
Cross-superposition of four BR barrier position histograms. (a) Both histograms show the same energy barriers. The smallest squares are aligned along the diagonal with positive slope indicating that the order of unfolding events is identical. The same holds true for b. However, histogram 4 lacks one energy barrier. Therefore the squares that are marked in green must be combined to determine the smallest matching steps.
FIGURE 6
FIGURE 6
Cross-superposition of Ig-TK barrier position histograms. The even increments of ∼29 nm, which are located in the upper right corner, are due to Ig/Fn domain unfolding (yellow). Segments between the major barriers of the titin kinase are marked in blue, green, and red. In a the segments are aligned along the diagonal with positive slope. This indicates that the order of unfolding events is the same in both traces. The titin kinase in contrast takes two different unfolding pathways in b. Because the two segments, marked in green and red, are aligned along the diagonal with negative slope, their order is changed.
FIGURE 7
FIGURE 7
Pattern recognition and screening for different single molecule compounds based on barrier position histograms. (a) Barrier position histogram of Ig-GFP. The even 29 nm spacings of the Ig-domain unfolding cause peaks in the autocorrelation function (b) at 29 nm and at integer multiples. The evaluation procedure of a trace takes into account the correlation at 29 nm and 58 nm as well as the sharpness of the peaks and yields a value of +8.7 (for details see Appendix). In this manner, a set of data can be filtered for relevant traces. To compare two different traces, the cross correlation of the corresponding barrier position histograms can be calculated. The result with the Ig-TK trace (c) and another Ig-TK trace (not shown) is diagramed in d and exhibits a correlation of 87%. In contrast, the correlation function in f of the traces of the two different molecules Ig-TK (c) and BR (e) only shows a correlation of 37%. In this way, traces of a multi-component sample could be classified and attributed to the corresponding molecules.

References

    1. Binnig, G., C. F. Quate, and C. Gerber. 1986. Atomic force microscope. Phys. Rev. Lett. 56:930–933. - PubMed
    1. Block, S. M., L. S. Goldstein, and B. J. Schnapp. 1990. Bead movement by single kinesin molecules studied with optical tweezers. Nature. 348:348–352. - PubMed
    1. Smith, S. B., Y. J. Cui, and C. Bustamante. 1996. Overstretching B-DNA: the elastic response of individual double-stranded and single-stranded DNA molecules. Science. 271:795–799. - PubMed
    1. Smith, S. B., L. Finzi, and C. Bustamante. 1992. Direct mechanical measurements of the elasticity of single DNA-molecules by using magnetic beads. Science. 258:1122–1126. - PubMed
    1. Evans, E., and K. Ritchie. 1997. Dynamic strength of molecular adhesion bonds. Biophys. J. 72:1541–1555. - PMC - PubMed

Publication types

LinkOut - more resources