. 2008 Jun 24;105(25):8637-42.
doi: 10.1073/pnas.0712179105. Epub 2008 Jun 12.

The fold of alpha-synuclein fibrils

Affiliations

The fold of alpha-synuclein fibrils

Marçal Vilar et al. Proc Natl Acad Sci U S A. .

Abstract

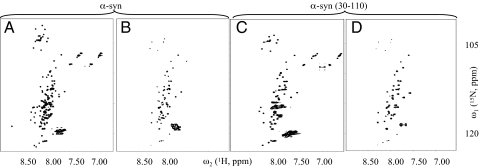
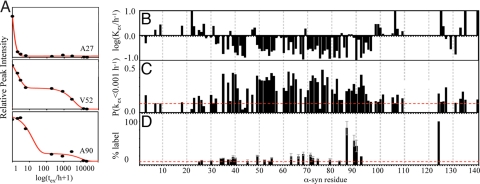
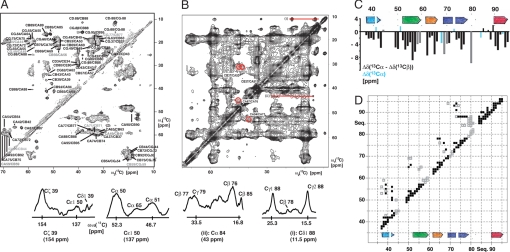
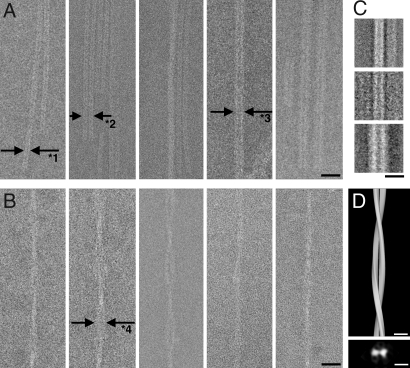
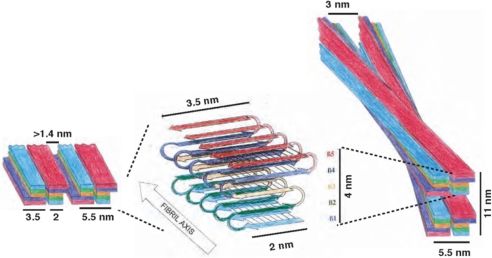
The aggregation of proteins into amyloid fibrils is associated with several neurodegenerative diseases. In Parkinson's disease it is believed that the aggregation of alpha-synuclein (alpha-syn) from monomers by intermediates into amyloid fibrils is the toxic disease-causative mechanism. Here, we studied the structure of alpha-syn in its amyloid state by using various biophysical approaches. Quenched hydrogen/deuterium exchange NMR spectroscopy identified five beta-strands within the fibril core comprising residues 35-96 and solid-state NMR data from amyloid fibrils comprising the fibril core residues 30-110 confirmed the presence of beta-sheet secondary structure. The data suggest that beta1-strand interacts with beta2, beta2 with beta3, beta3 with beta4, and beta4 with beta5. High-resolution cryoelectron microscopy revealed the protofilament boundaries of approximately 2 x 3.5 nm. Based on the combination of these data and published structural studies, a fold of alpha-syn in the fibrils is proposed and discussed.


Conflict of interest statement

The authors declare no conflict of interest.

Figures

Fig. 1.
Fig. 1.
A qualitative interpretation of quenched H/D exchange of α-syn and α-syn (30–110) fibrils based on NMR spectra. Fast [15N,1H]-HMQC-spectra of solubilized 15N-labeled α-syn in d6-DMSO containing 0.1% d1-TFA, corresponding to fully protonated (A) and 1 h exchanged amyloid fibrils of α-syn (B). Many cross-peaks are lost on H/D exchange for 1 h. In C and D fast [15N,1H]-HMQC-spectra of 15N-labeled α-syn (30–110) solubilized in d6-DMSO containing 0.1% d1-TFA, corresponding to fully protonated, and 1 h exchanged amyloid fibrils of α-syn (30–110), respectively. The amino acid assignment of the cross-peaks of the spectrum shown in C are shown in Fig. S2.
Fig. 2.
Fig. 2.
Detailed H/D exchange analysis and side-chain solvent accessibility of α-syn fibrils. (A) H/D exchange curves for several amide moieties as indicated. The peak volumes versus logarithm of the exchange time are shown. Data points are shown as spheres. Smooth red lines represent a superposition of two monoexponential fits of the raw data. For most residues a biphasic exchange is observed including a slow decay (≈1–10 h) and an extremely slow decay (>1,000 h). (B) Plot of the H/D exchange rates of the fast- and slow-exchanging population against the amino acid sequence. (C) Plot of the fraction of each amide moiety that exhibit extremely slow H/D exchange at rates <0.001 h−1. This representation enables us to highlight the solvent protection of amides of the population defined as extremely slow-exchanging by taking into consideration that this conformation may comprise fast-exchanging amides in loops and turns. Only if the fraction is >0.15 is it considered that the amide undergoes a very slow exchange in the sample, because an accuracy of ≈10% is obtained by fitting the data with a superposition of two monoexponential decays. The amide moieties for which H/D exchange data were obtained are labeled with a single-letter amino acid code. (D) Side-chain solvent accessibility of Cys in fibrils of α-syn variants. The fluorescence of Alexa Fluor 488 cross-linked to the Cys side chain is given for various α-syn variants relative to the A124C variant. The side chain of residue 124 is, in accordance to H/D exchange, EPR, solid-state NMR, and limited proteolysis studies, highly solvent exposed. A large fluorescence value is indicative of a high degree of solvent accessibility.
Fig. 3.
Fig. 3.
Solid-state NMR of α-syn (30–110) fibrils. (A) 13C–13C DREAM spectrum for the intraresidual assignment. (B) 13C–13C proton-driven spin diffusion (PDSD) spectrum with a mixing time of 250 ms. Long-range cross-peaks are indicated by red circles and labeled accordingly. In addition, several cross-sections with long-range cross-peaks are shown and labeled accordingly. (C) Secondary chemical shift plot of the difference of Δδ(13Cα) − Δδ(13Cβ) with Δδ(13Cα) and Δδ(13Cβ), which are the differences between experimental 13Cα or 13Cβ chemical shifts and their corresponding “random-coil” chemical shifts. Highlighted in cyan are Gly residues for which only the Δδ(13Cα) could be calculated. Highlighted in gray are ambiguous assignments. This secondary chemical shift plot indicates the presence of β-strand motifs as indicated. (D) 2D distance plot of α-syn (30–110) fibrils showing distance restraints < ≈6 Å between residues, which have been extracted from the 13C–13C proton-driven spin diffusion spectra. Black squares indicate unambiguous distance restraints between residues. Gray squares indicate distances, which are only unambiguous under the assumption that α-synuclein fibrils form a five-layered β-sandwich. In addition, the β-strand motifs extracted from C are shown.
Fig. 4.
Fig. 4.
Cryo-negative stain transmission electron microscopy of straight wild-type α-syn and twisted α-syn (30–110) fibrils. In both cases, different bundling states can be observed. The straight filament is composed of a basic strand formed of two denser lines of 2.0-nm width separated by a gap of 1.5 nm (A, arrows labeled with “*1”) and tends to dimerize (A, arrows labeled with “*2”). Thicker filaments can be interpreted as tilted views of dimeric strands (A Right Center and Right), or as a different aggregation state. Straight filaments allowed the calculation of particle class averages, reproduced in C from 146, 39, and 71 particles (Top to Bottom). Twisted filaments also show variable thicknesses or density (B) and allowed a helical 3D reconstruction in D. D Lower shows the cross-section of the helical filament. (Scale bars: A and B, 20 nm; C and D, 10 nm.)
Fig. 5.
Fig. 5.
Proposed fold of α-syn fibrils. The proposed fold of a monomeric α-syn within a protofilament is shown in Center. The incorporation of a protofilament into the straight (Left) and twisted (Right) fibril type is indicated by a schematic drawing.

References

    1. Goedert M. Alpha-synuclein and neurodegenerative diseases. Nat Rev Neurosci. 2001;2:492–501. - PubMed
    1. Cookson MR. The biochemistry of Parkinson's disease. Annu Rev Biochem. 2005;74:29–52. - PubMed
    1. Recchia A, et al. Alpha-synuclein and Parkinson's disease. FASEB J. 2004;18:617–626. - PubMed
    1. Lee VM, Trojanowski JQ. Mechanisms of Parkinson's disease linked to pathological alpha-synuclein: New targets for drug discovery. Neuron. 2006;52:33–38. - PubMed
    1. Hashimoto M, Rockenstein E, Masliah E. Transgenic models of alpha-synuclein pathology: Past, present, and future. Ann NY Acad Sci. 2003;991:171–188. - PubMed

Publication types

MeSH terms

LinkOut - more resources