. 2008 Sep 1;112(5):1813-21.
doi: 10.1182/blood-2008-03-144980. Epub 2008 Jun 11.

Notch1 and TGFbeta1 cooperatively regulate Foxp3 expression and the maintenance of peripheral regulatory T cells

Affiliations

Notch1 and TGFbeta1 cooperatively regulate Foxp3 expression and the maintenance of peripheral regulatory T cells

Jeremy B Samon et al. Blood. .

Abstract

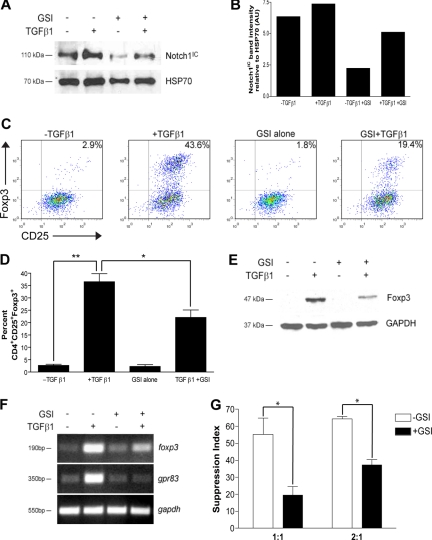
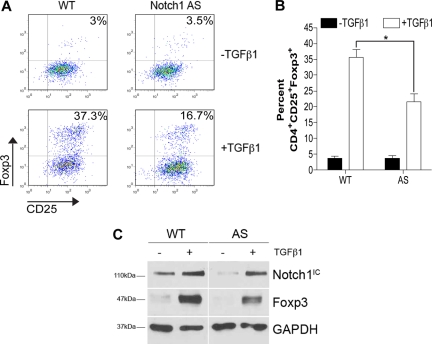
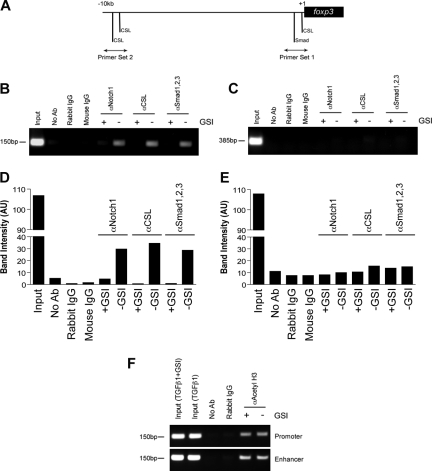
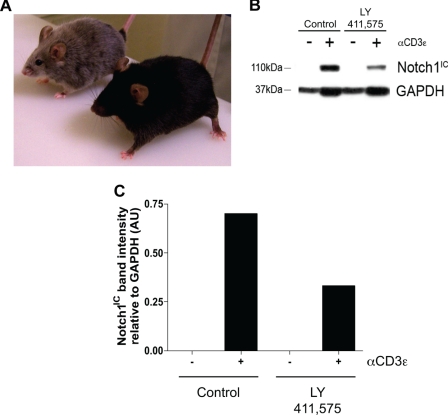
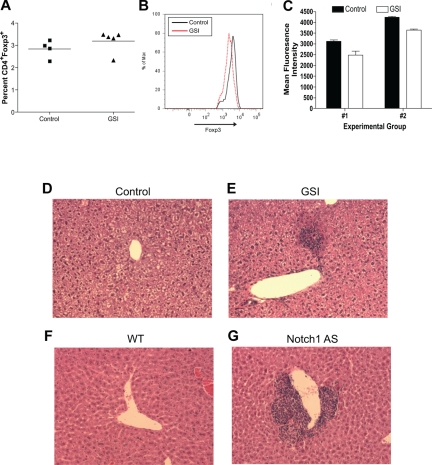
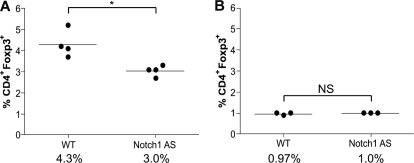
Notch and its ligands have been implicated in the regulation and differentiation of various CD4(+) T-helper cells. Regulatory T cells (T(regs)), which express the transcription factor Foxp3, suppress aberrant immune responses that are typically associated with autoimmunity or excessive inflammation. Previous studies have shown that transforming growth factor beta (TGFbeta1) induces Foxp3 expression and a regulatory phenotype in peripheral T cells. Here, we show that pharmacologic inhibition of Notch signaling using gamma-secretase inhibitor (GSI) treatment blocks (1) TGFbeta1-induced Foxp3 expression, (2) the up-regulation of Foxp3-target genes, and (3) the ability to suppress naive T-cell proliferation. In addition, the binding of Notch1, CSL, and Smad to conserved binding sites in the foxp3 promoter can be inhibited by treatment with GSI. Finally, in vivo administration of GSI results in reduced Foxp3 expression and development of symptoms consistent with autoimmune hepatitis, a disease previously found to result from dysregulation of TGFbeta signaling and regulatory T cells. Together, these findings indicate that the Notch and TGFbeta signaling pathways cooperatively regulate Foxp3 expression and regulatory T-cell maintenance both in vitro and in vivo.


Figures

Figure 1
Figure 1
In vitro GSI treatment blocks TGFβ1-induced Foxp3 expression and function. CD4+CD25 splenocytes were isolated and stimulated under the following conditions: no treatment, + TGFβ1, + GSI alone, or + GSI + TGFβ1. (A) Notch1 expression in cells pretreated without or with GSI was evaluated by immunoblotting using antibodies that recognized the cleaved, active form of Notch1 (Notch1IC). Antibody specific for HSP70 was used to control for loading. (B) Graphic representation of band intensities shown in panel A. (C) Effect of GSI treatment on Foxp3 expression was analyzed by flow cytometry using antibodies specific for CD4, CD25, and Foxp3. All plots are gated on live CD4+ cells. (D) Graphic representation of flow cytometry data from panel C. Data represent the means (± SD). **P = .001; *P < .05. (E) Foxp3 expression in CD4+CD25+ T cells treated without or with GSI was assessed by immunoblotting using antibodies specific for Foxp3. GAPDH was used as a loading control. (F) To assess the effects of GSI treatment on transcriptional regulation of foxp3, and its downstream target gene gpr83, total RNA was isolated from cells cultured under the conditions described in “RNA isolation and reverse-transcription–polymerase chain reaction” and analyzed by RT-PCR. Amplification of gapdh served as a loading control. (G) Cells were polarized as indicated in “Methods,” then washed, and cocultured at a 1:1 or 2:1 ratio with freshly isolated CD4+ T cells plus γ-irradiated APCs for 72 hours. *P < .05. Data are represented as mean suppression index (± SD). All results are representative of at least 2 independent experiments.
Figure 2
Figure 2
Impaired Foxp3 induction in cells expressing reduced levels of Notch1. CD4+CD25 splenocytes from either wild-type (WT) or Notch1 antisense (AS) mice were stimulated with plate-bound αCD3ϵ plus αCD28 for 72 hours in the presence or absence of 2 ng/mL TGFβ1. (A) Cells were analyzed by flow cytometry using antibodies specific for CD4, CD25, and Foxp3. All plots are gated on live CD4+ cells. Plots are representative of 3 independent experiments. (B) Graphic representation of flow cytometry data from panel A. Data represented as the mean (± SD) of 3 samples per group. *P < .05. (C) Immunoblot detection of Foxp3, Notch1 intracellular domain (Notch1IC), and GAPDH (loading control) from whole-cell lysates prepared from cells stimulated under the same conditions as in panel A. Data are representative of 2 independent experiments.
Figure 3
Figure 3
In vitro GSI treatment blocks the binding of Notch1, CSL, and Smad to the foxp3 promoter without inhibiting histone acetylation. Chromatin immunoprecipitation (ChIP) of CD4+CD25 splenocytes stimulated with plate-bound αCD3ϵ plus αCD28 and 2 ng/mL TGFβ1 in the presence or absence of GSI for 24 hours. (A) Primer sets were designed to span putative CSL and Smad binding sites within the foxp3 promoter. Rabbit αNotch1, rabbit αCSL, and mouse αSmad1/2/3 were used to immunoprecipitate protein-DNA complexes. De–cross-linked DNA was amplified by PCR using either primer set 1 (B) or primer set 2 (D). Band intensities were calculated using ImageJ software, version 1.38 (National Institutes of Health, Bethesda, MD; panels C,E). Data are representative of 3 independent experiments. (F) ChIP assay using antibody specific for acetylated histone H3 (αacetyl H3) and either primer set 1 from panel A or the region of the Foxp3 enhancer containing previously identified Smad3 and NFAT binding sites. Data are representative of 2 independent experiments. Input indicates total chromatin. No Ab (beads only), rabbit IgG, and mouse IgG were used as isotype controls.
Figure 4
Figure 4
Administration of LY 411575 at a dose of 5 mg/kg per day is sufficient to reduce Notch1 activation in vivo. C57BL/6 mice were fed Harlan-Teklad rodent chow formulated with LY 411575 to deliver 5 mg/kg per day for 3 months. (A) Progressive hair graying evident in GSI-fed (silver mouse, n = 5) but not control chow-fed (black mouse, n = 4) mice. (B) Bulk splenocytes were harvested from mice fed chow containing LY 411575 at the dose previously described for 3 months, and were cultured for 72 hours with or without αCD3ϵ stimulation. Whole-cell lysates were prepared, and Notch1IC and GAPDH expression was detected by immunoblot. Data are representative of n = 4 (control) and n = 5 (GSI). (C) Graphic representation of band intensities from panel B. Expression of Notch1IC was normalized to GAPDH expression.
Figure 5
Figure 5
Reduced in vivo Notch signaling results in reduced Foxp3 expression within the Treg pool and spontaneous lymphocyte infiltration of the liver. For 3 months, wild-type mice were fed either normal rodent chow (control, n = 4) or chow formulated with LY 411575 (GSI, n = 5) to deliver 5 mg/kg per day. (A) Bulk splenocytes were stained for flow cytometry with antibodies specific for CD4 and Foxp3. Values represent mean percentages. (B) Histogram representing level of Foxp3 expression, gated on live CD4+Foxp3+ cells. Data are representative of data collected from 2 independent experimental groups (group 1: control, n = 2 and GSI, n = 3; group 2: control, n = 2 and GSI, n = 2). (C) Graphic representation of mean fluorescence intensity of Foxp3 staining in all experimental groups from panel B. Values represent the mean. (D-G) H&E staining of livers from mice with normal (D,F) or reduced (E,G) levels of Notch1 signaling. One representative liver section from each group is shown: (D) control mouse, (E) GSI chow-fed mouse, (F) wild-type mouse (n = 6), (G) Notch1 antisense mouse (n = 6). A Spot digital camera (Diagnostic Instruments, Sterling Heights, MI) mounted on a Zeiss Axioscope microscope (Carl Zeiss, Jena, Germany) using a 20× objective was used to acquire figures.
Figure 6
Figure 6
Defective regulatory T-cell maintenance in mice expressing reduced levels of Notch1. Bulk splenocytes (A) or thymocytes (B) were harvested from WT or Notch1 antisense (AS) mice and then stained with antibodies specific for CD4 and Foxp3 for analysis by flow cytometry. *P < .05. NS indicates not significant.

References

    1. Osborne BA, Minter LM. Notch signalling during peripheral T-cell activation and differentiation. Nat Rev Immunol. 2007;7:64–75. - PubMed
    1. Parks AL, Curtis D. Presenilin diversifies its portfolio. Trends Genet. 2007;23:140–150. - PubMed
    1. Aster JC. Deregulated NOTCH signaling in acute T-cell lymphoblastic leukemia/lymphoma: new insights, questions, and opportunities. Int J Hematol. 2005;82:295–301. - PubMed
    1. Siemers ER, Quinn JF, Kaye J, et al. Effects of a gamma-secretase inhibitor in a randomized study of patients with Alzheimer disease. Neurology. 2006;66:602–604. - PubMed
    1. Amsen D, Antov A, Jankovic D, et al. Direct regulation of Gata3 expression determines the T helper differentiation potential of Notch. Immunity. 2007;27:89–99. - PMC - PubMed

Publication types

MeSH terms

Substances