

Hypoxia-induced human endonuclease G expression suppresses tumor growth in a xenograft model
- PMID: 18551145
- PMCID: PMC4263319
- DOI: 10.1038/cgt.2008.39
Hypoxia-induced human endonuclease G expression suppresses tumor growth in a xenograft model
Abstract
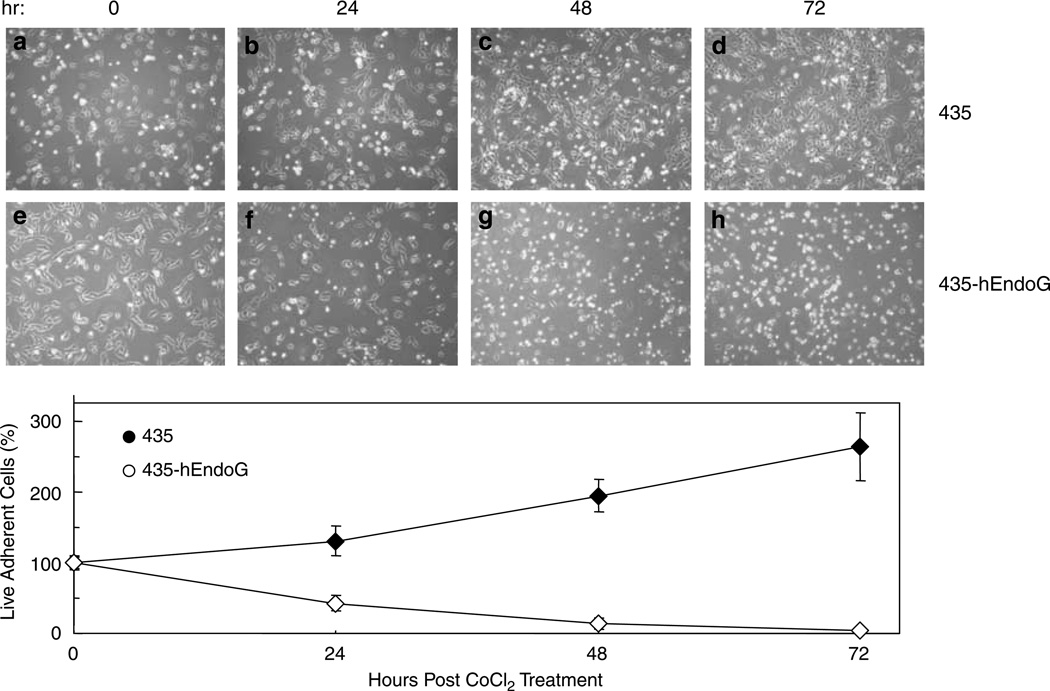
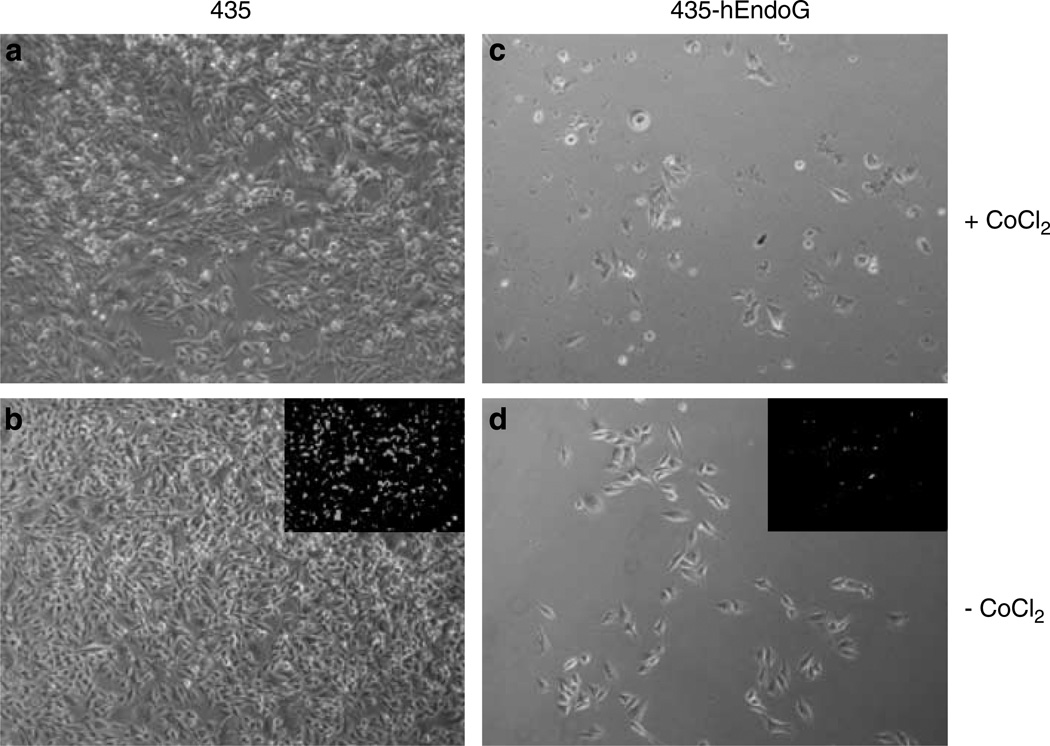
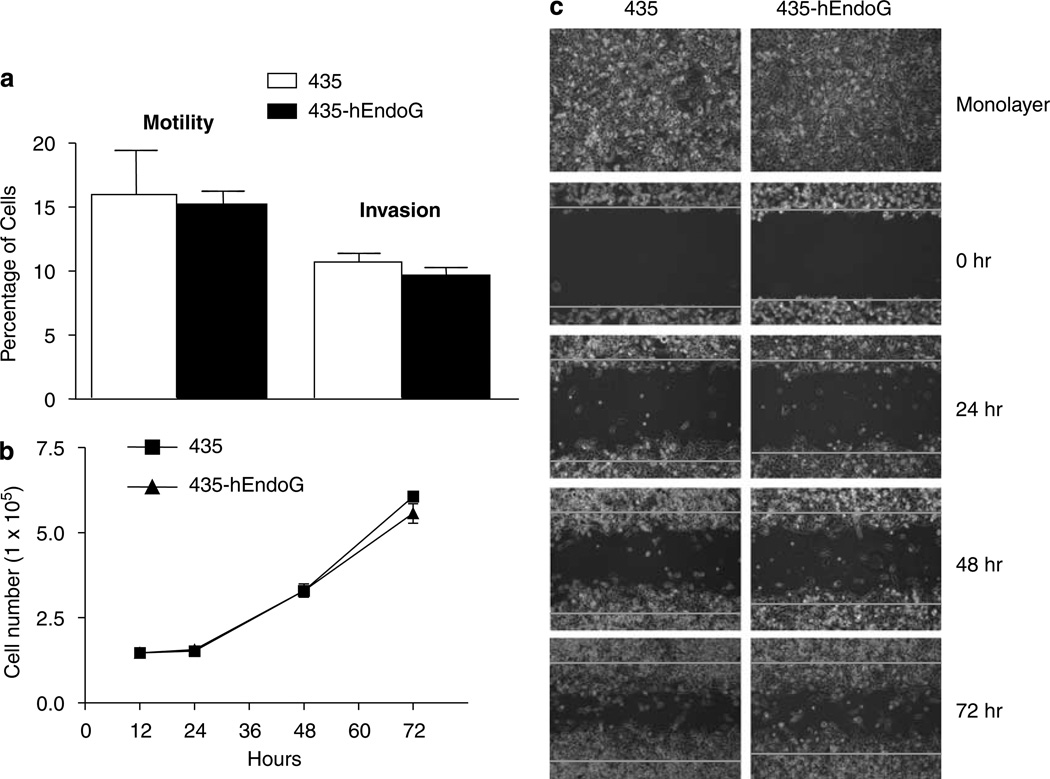
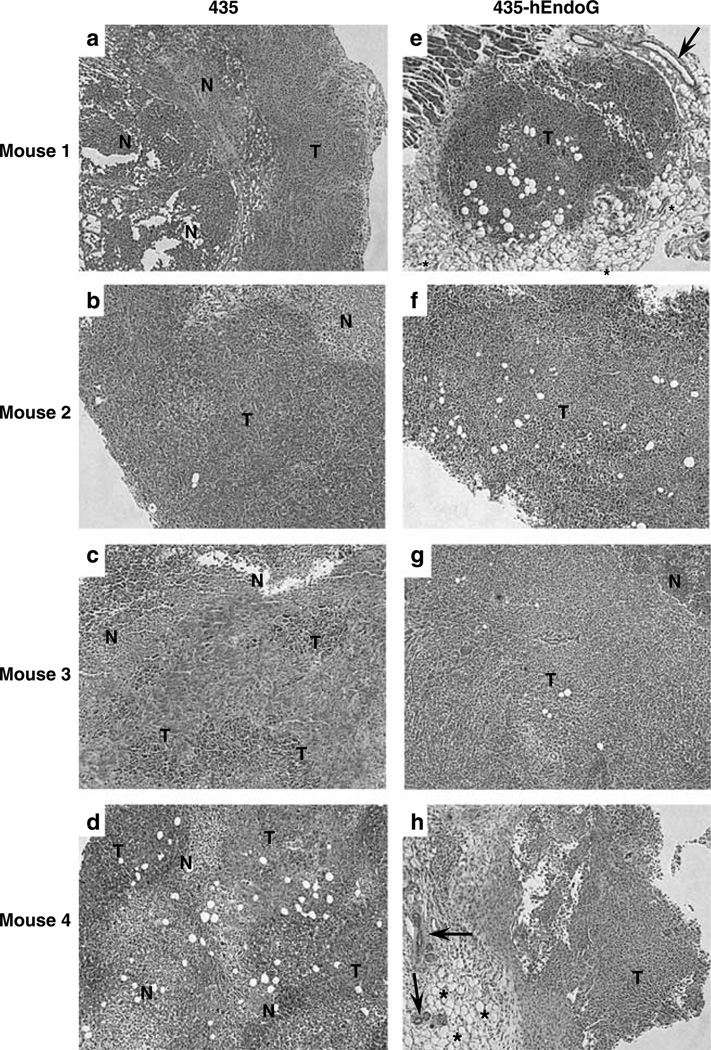
We have developed a hypoxia-inducible gene therapy approach for the expression of the mature form of human endonuclease G to facilitate cell death in hypoxic regions of the tumor. The chimeric therapeutic gene is placed under the control of a hypoxia response element based promoter and contains a translocation motif linked in frame to an oxygen-dependent degradation domain and the endonuclease G gene. Transient expression of the chimeric therapeutic gene in breast and prostate cancer cell lines resulted in efficient cell death under hypoxia-mimetic conditions. Stable MDA-MB-435 cells expressing the chimeric therapeutic gene under 1% O2 showed an increase in stable HIF-1alpha protein levels and synthesis of the endonuclease G protein in a time-dependent manner. In normoxic conditions, these stable transgenic cells exhibited no change in growth rate, invasion and motility when compared to parental cells. Moreover, xenografts generated using the transgenic cells exhibited highly significant suppression of tumor growth in a preclinical cancer model compared to the parental cell line. Thus, the hypoxia-modulated endonuclease G expression has the potential to be used as a gene-based-therapy system to kill malignant cells within hypoxic regions of tumors.
Figures


Similar articles
-
Oncolytic effects of adenovirus mutant capable of replicating in hypoxic and normoxic regions of solid tumor.Mol Ther. 2004 Nov;10(5):938-49. doi: 10.1016/j.ymthe.2004.07.023. Mol Ther. 2004. PMID: 15509511
-
ERRα augments HIF-1 signalling by directly interacting with HIF-1α in normoxic and hypoxic prostate cancer cells.J Pathol. 2014 May;233(1):61-73. doi: 10.1002/path.4329. Epub 2014 Feb 5. J Pathol. 2014. PMID: 24425001
-
Cyclin-dependent kinase inhibitor, P276-00, inhibits HIF-1α and induces G2/M arrest under hypoxia in prostate cancer cells.Prostate Cancer Prostatic Dis. 2012 Mar;15(1):15-27. doi: 10.1038/pcan.2011.51. Epub 2011 Nov 15. Prostate Cancer Prostatic Dis. 2012. PMID: 22083267
-
PIM Kinase Inhibitors Kill Hypoxic Tumor Cells by Reducing Nrf2 Signaling and Increasing Reactive Oxygen Species.Mol Cancer Ther. 2016 Jul;15(7):1637-47. doi: 10.1158/1535-7163.MCT-15-1018. Epub 2016 May 16. Mol Cancer Ther. 2016. PMID: 27196781 Free PMC article.
-
Hypoxia-inducible factor-1 in human breast and prostate cancer.Endocr Relat Cancer. 2006 Sep;13(3):739-49. doi: 10.1677/erc.1.00728. Endocr Relat Cancer. 2006. PMID: 16954428 Review.
Cited by
-
Nuclear endonuclease G controls cell proliferation in ovarian cancer.FEBS Open Bio. 2023 Apr;13(4):655-669. doi: 10.1002/2211-5463.13572. Epub 2023 Feb 13. FEBS Open Bio. 2023. PMID: 36734593 Free PMC article.
-
Anti-ROR1 scFv-EndoG as a Novel Anti-Cancer Therapeutic Drug.Asian Pac J Cancer Prev. 2018 Jan 27;19(1):97-102. doi: 10.22034/APJCP.2018.19.1.97. Asian Pac J Cancer Prev. 2018. PMID: 29373898 Free PMC article.
-
Exploiting the tumor microenvironment for theranostic imaging.NMR Biomed. 2011 Jul;24(6):636-47. doi: 10.1002/nbm.1664. Epub 2011 Jan 28. NMR Biomed. 2011. PMID: 21793072 Free PMC article. Review.
References
-
- Sartorelli AC. Therapeutic attack of hypoxic cells of solid tumors: presidential address. Cancer Res. 1988;48:775–778. - PubMed
-
- Ahn GO, Brown M. Targeting tumors with hypoxia-activated cytotoxins. Front Biosci. 2007;12:3483–3501. - PubMed
-
- Boast K, Binley K, Iqball S, Price T, Spearman H, Kingsman S, et al. Characterization of physiologically regulated vectors for the treatment of ischemic disease. Hum Gene Ther. 1999;10:2197–2208. - PubMed
-
- Binley K, Iqball S, Kingsman A, Kingsman S, Naylor S. An adenoviral vector regulated by hypoxia for the treatment of ischaemic disease and cancer. Gene Ther. 1999;6:1721–1727. - PubMed
-
- Koshikawa N, Takenaga K, Tagawa M, Sakiyama S. Therapeutic efficacy of the suicide gene driven by the promoter of vascular endothelial growth factor gene against hypoxic tumor cells. Cancer Res. 2000;60:2936–2941. - PubMed
Publication types
MeSH terms
Substances
Grants and funding
LinkOut - more resources
Full Text Sources
Other Literature Sources
Medical
Miscellaneous
