. 2008 Jun 13;4(6):e1000087.
doi: 10.1371/journal.ppat.1000087.

Ameobal pathogen mimivirus infects macrophages through phagocytosis

Affiliations

Ameobal pathogen mimivirus infects macrophages through phagocytosis

Eric Ghigo et al. PLoS Pathog. .

Abstract

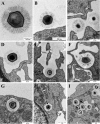
Mimivirus, or Acanthamoeba polyphaga mimivirus (APMV), a giant double-stranded DNA virus that grows in amoeba, was identified for the first time in 2003. Entry by phagocytosis within amoeba has been suggested but not demonstrated. We demonstrate here that APMV was internalized by macrophages but not by non-phagocytic cells, leading to productive APMV replication. Clathrin- and caveolin-mediated endocytosis pathways, as well as degradative endosome-mediated endocytosis, were not used by APMV to invade macrophages. Ultrastructural analysis showed that protrusions were formed around the entering virus, suggesting that macropinocytosis or phagocytosis was involved in APMV entry. Reorganization of the actin cytoskeleton and activation of phosphatidylinositol 3-kinases were required for APMV entry. Blocking macropinocytosis and the lack of APMV colocalization with rabankyrin-5 showed that macropinocytosis was not involved in viral entry. Overexpression of a dominant-negative form of dynamin-II, a regulator of phagocytosis, inhibited APMV entry. Altogether, our data demonstrated that APMV enters macrophages through phagocytosis, a new pathway for virus entry in cells. This reinforces the paradigm that intra-amoebal pathogens have the potential to infect macrophages.


Conflict of interest statement

The authors have declared that no competing interests exist.

Figures

Figure 1
Figure 1. Multiple portals of virus entry into mammalian cells.
(1) Clathrin-mediated entry (i.e. Vesicular Stomatitis virus), (2) fusion-entry (i.e. Human immunodeficiency virus), (3) macropinocytosis-mediated entry (i.e Vaccinia virus), (4) phagocytosis-like-mediated entry (i.e. Herpes simplex virus), (5) phagocytosis-mediated entry (i.e. bacteria), (6) caveolin-mediated entry (i.e. Simian virus 40).
Figure 2
Figure 2. Cell infection with APMV.
(A) Cells were incubated with APMV (50 PFU/cell) for 6 hours, extensively washed, and the number of viral DNA copies was determined by qPCR. (B) Macrophages were infected with different concentrations of APMV for different periods of time. After washing, the number of viral DNA copies was determined by qPCR. (C) Macrophages were infected with APMV (50 PFU/cell) for 6 hours (t = 0). After washing, macrophages were incubated for an additional period of 30 hours and viral particles were recovered. The number of viral DNA copies was determined by qPCR. (D) The infectivity of APMV particles was evaluated by incubating viral particles with amoebae and PFU were scored. The results are the mean±SD of 5 experiments. *p<0.05.
Figure 3
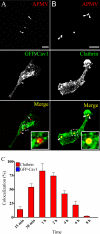
Figure 3. APMV particles colocalize with clathrin, but not with caveolin-1.
(A) RAW 264.7 macrophages overexpressing GFP-caveolin-1 (GFP-Cav1) were incubated with APMV particles (50 PFU/cell) for 15 min. Viral particles were visualized by indirect immunofluorescence and laser scanning microscopy. The lack of colocalization with GFP-caveolin-1 was demonstrated by merging fluorescent images. (B) RAW 264.7 macrophages were incubated with APMV particles (50 PFU/cell) for 1 hour. The colocalization of viral particles with Alexa 488-conjugated clathrin antibodies was determined. Merged images showed the colocalization of APMV particles with clathrin. Inset confirms the colocalization of clathrin with viral particles. (C) RAW 264.7 macrophages were incubated with APMV particles (50 PFU/cell) for different periods. The number of APMV particles that colocalized with clathrin was scored. The results are expressed as the percentage of AMPV particles that colocalized with clathrin and are the mean±SD of 4 experiments. Scale bars represent 3 µm.
Figure 4
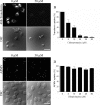
Figure 4. Role of clathrin in APMV internalization.
(A) RAW 264.7 macrophages were pretreated with 50 µM chlorpromazine for 30 min and incubated with 50 µg/ml Alexa 488-conjugated transferrin for 15 min. The intracellular distribution of fluorescent transferrin was studied in control macrophages (left panels) and in chlorpromazine-pretreated macrophages (right panels). (B) Macrophages were pretreated with different concentrations of chlorpromazine and incubated with fluorescent transferrin. The results, expressed as the percentage of transferrin uptake relative to the control, are the mean±SD of 3 experiments. (C) Macrophages were pretreated with 50 µM chlorpromazine for 30 min before a 6-hour infection with APMV (50 PFU/cell) in the presence of 20 µM monensin to limit chlorpromazine toxicity. APMV particles were revealed by indirect immunofluorescence. Their intracellular distribution was studied in control macrophages (left panels) and in chlorpromazine-pretreated macrophages (right panels). (D) Macrophages were treated with different concentrations of chlorpromazine and incubated with APMV particles. Viral particles were visualized by immunofluorescence. The results, expressed as the percentage of APMV uptake relative to the control, are the mean±SD of 5 experiments. Scale bars represent 50 µm.
Figure 5
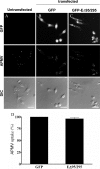
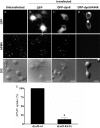
Figure 5. Dominant negative mutant of Eps15 does not inhibit APMV internalization.
RAW 264.7 macrophages (A), macrophages transiently transfected with GFP (B) and dominant-negative mutant of Eps15 (EΔ95/295) (C) were infected with APMV (50 PFU/cell) for 6 hours. Viral particles were visualized by immunofluorescence (middle panels). Viral particles were associated with macrophages transfected with EΔ95/295. (D) The number of APMV particles internalized was scored. The results, expressed as the percentage of APMV uptake relative to the control, are the mean±SD of 4 experiments. Scale bars represent 25 µm.
Figure 6
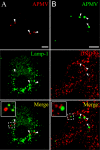
Figure 6. Lack of colocalization of APMV particles with Lamp-1 and lysotracker red DND99.
(A) RAW 264.7 macrophages were incubated with APMV particles (50 PFU/cell) for 15 min. Viral particles and Lamp-1 were visualized by indirect immunofluorescence and laser scanning microscopy. The lack of colocalization of viral particles with Lamp-1 was demonstrated by merging fluorescent images. (B) RAW 264.7 macrophages loaded with lysotracker red DND99 were incubated with APMV particles (50 PFU/cell) for 15 min. The colocalization of viral particles with lysotracker red DND99 was determined. Merged images showed that APMV particles did not colocalize with lysotracker red DND99. Insets confirmed the lack of colocalization of viral particles with Lamp-1 or lysotracker red DND99. Scale bars represent 3 µm.
Figure 7
Figure 7. Electron microscopic analysis of APMV internalization.
APMV (500 PFU per macrophage) was incubated with RAW 264.7 macrophages for different periods. (A) Isolated APMV. (B) APMV bound to the cell body. (C) APMV attached to cellular extensions. (D and E) Cup-like indentation formed at the cell surface and large cellular extensions starting to embrace APMV. (F) Engulfed APMV. (G) Large smooth-surfaced endocytic vesicle containing APMV. (H) APMV-containing vesicle deeper in the cytoplasm. (I) APMV-containing vesicles that occasionally fused with each other.
Figure 8
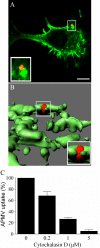
Figure 8. Role of F-actin in APMV internalization.
(A) RAW 264.7 macrophages were incubated with APMV particles (50 PFU/cell) for 5 min. F-actin distribution was studied using bodipy phallacidin (green) and APMV localization was detected by immunofluorescence (red). (B) 3D reconstruction of the precedent image. The images are representative of 3 independent experiments. (C) Macrophages were treated with different concentrations of cytochalasin D for 30 min and incubated with APMV particles for 6 hours. Viral particles were visualized by immunofluorescence. The results, expressed as the percentage of APMV uptake relative to the control, are the mean±SD of 3 experiments. Scale bars represent 3 µm.
Figure 9
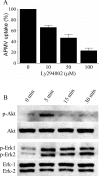
Figure 9. Role of the PI3K pathway in APMV internalization.
(A) RAW 264.7 Macrophages were pretreated with different concentrations of LY294002 for 30 min and incubated with APMV particles for 6 hours in the presence of LY294002. Viral particles were visualized by immunofluorescence. The results, expressed as the percentage of APMV uptake relative to the control, are the mean±SD of 3 experiments. (B) Immunoblotting of macrophages stimulated with APMV particles (50 PFU/cell) for different periods was performed with antibodies specific for phosphorylated Akt and ERK. Membranes were stripped and reprobed with anti-Akt and -ERK antibodies, respectively. Each blot is representative of three distinct experiments.
Figure 10
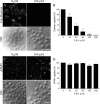
Figure 10. Macropinocytosis is not involved in APMV internalization.
(A) RAW 264.7 macrophages were pretreated with 100 µM EIPA for 30 min and incubated with 3 mg/ml FITC-dextran for 30 min. The intracellular distribution of fluorescent dextran was studied in control macrophages (left panels) and in EIPA-pretreated macrophages (right panels). (B) Macrophages were pretreated with different concentrations of EIPA and incubated with FITC-dextran. The results, expressed as the percentage of dextran uptake relative to the control, are the mean±SD of 5 experiments. (C) Macrophages were pretreated with 100 µM EIPA for 30 min before a 6-hour infection with APMV (50 PFU/cell). APMV particles were visualized by indirect immunofluorescence. Their intracellular distribution was studied in control macrophages (left panels) and in EIPA-pretreated macrophages (right panels). (D) Macrophages were pretreated with different concentrations of EIPA and incubated with APMV particles for 6 hours in presence of EIPA. Viral particles were visualized by immunofluorescence. The results, expressed as the percentage of APMV uptake relative to the control, are the mean±SD of 5 experiments. Scale bars represent 50 µm.
Figure 11
Figure 11. Rabankyrin-5 does not colocalize with APMV.
(A) RAW 264.7 macrophages were incubated with 3 mg/ml FITC-dextran for 30 min (top panel). Rabankyrin-5 was revealed using specific antibodies (middle panel). The colocalization of FITC-dextran and rabankyrin-5 was demonstrated by merging fluorescent images (bottom panel). (B) Macrophages were infected with APMV (50 PFU/cell) for 30 min (top panel). Rabankyrin-5 was revealed using specific antibodies (middle panel). The lack of colocalization of APMV particles with rabankyrin-5 was demonstrated by merging fluorescent images (bottom panel). Scale bars represent 5 µm.
Figure 12
Figure 12. Role of dynamin-II in M. avium internalization.
RAW 264.7 macrophages (A), macrophages transiently transfected with GFP (B), GFP-tagged active (C) or dominant-negative (D) dynamin-II were infected with Texas red-labelled M. avium (10 bacteria/cell) for 6 hours. Fluorescent organisms were visualized by epifluorescence (middle panels). Bacteria were not associated with macrophages transfected with the dominant-negative mutant of dynamin-II. (E) The number of internalized bacteria was scored. The results, expressed as the percentage of bacterial uptake relative to the control, are the mean±SD of 4 experiments. Scale bars represent 25 µm. *p<0.05.
Figure 13
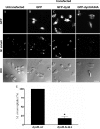
Figure 13. Role of dynamin-II in APMV internalization.
RAW 264.7 macrophages (A), macrophages transiently transfected with GFP (B), GFP-tagged active (C) or dominant-negative (D) dynamin-II were infected with APMV (50 PFU/cell) for 6 hours. Viral particles were visualized by immunofluorescence (middle panels). Viral particles were not associated with macrophages transfected with the dominant-negative mutant of dynamin-II. (E) The number of APMV particles internalized was scored. The results, expressed as the percentage of APMV uptake relative to the control, are the mean±SD of 3 experiments. Scale bars represent 50 µm. *p<0.05.
Figure 14
Figure 14. APMV enters macrophages through a phagocytic process.
After binding with macrophages, AMPV induces PI3K activation and F-actin polymerization. AMPV particules are engulfed by a mechanism invoving F-actin (blue), clathrin (red) and dynamin-II (yellow). APMV internalization is inhibited by cytochalasin D (CytoD), Ly294002 and the dominant-negative form of the dynamin-II (dynII-K44A), but is not affected by EIPA, chlorpromazine and dominant-negative form of Eps15 (EΔ95/295). The mechanism of APMV replication remains unknown.

Similar articles

Cited by

References

    1. La Scola B, Audic S, Robert C, Jungang L, de Lamballerie X, et al. A giant virus in amoebae. Science. 2003;299:2033. - PubMed
    1. Raoult D, La Scola B, Birtles R. The discovery and characterization of Mimivirus, the largest known virus and putative pneumonia agent. Clin Infect Dis. 2007;45:95–102. - PubMed
    1. Khan M, La Scola B, Lepidi H, Raoult D. Pneumonia in mice inoculated experimentally with Acanthamoeba polyphaga mimivirus. Microb Pathog. 2007;42:56–61. - PubMed
    1. Xiao C, Chipman PR, Battisti AJ, Bowman VD, Renesto P, et al. Cryo-electron microscopy of the giant Mimivirus. J Mol Biol. 2005;353:493–496. - PubMed
    1. Suzan-Monti M, Scola BL, Barrassi L, Espinosa L, Raoult D. Ultrastructural Characterization of the Giant Volcano-like Virus Factory of Acanthamoeba polyphaga Mimivirus. PLoS ONE. 2007;2:e328. doi:10.1371/journal.pone.0000328. - PMC - PubMed

Publication types