. 2008 Jun 13;4(6):e1000097.
doi: 10.1371/journal.pgen.1000097.

Mitochondrial morphogenesis, dendrite development, and synapse formation in cerebellum require both Bcl-w and the glutamate receptor delta2

Affiliations

Mitochondrial morphogenesis, dendrite development, and synapse formation in cerebellum require both Bcl-w and the glutamate receptor delta2

Qiong A Liu et al. PLoS Genet. .

Abstract

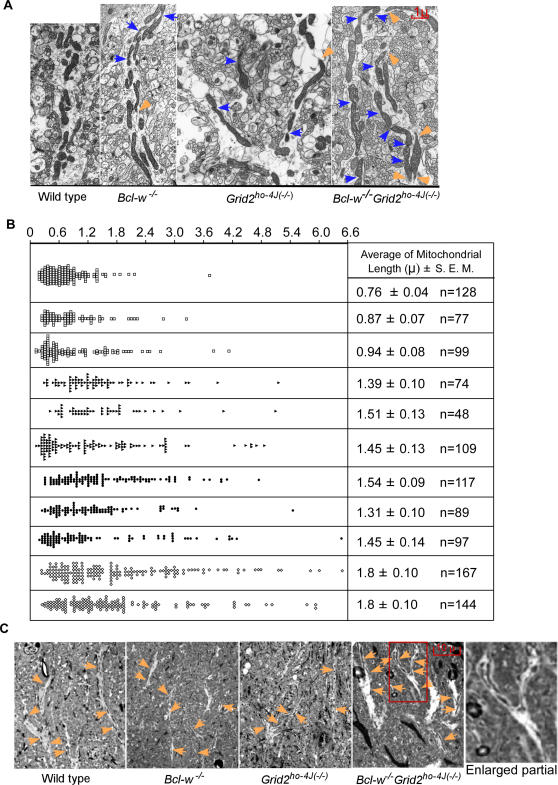
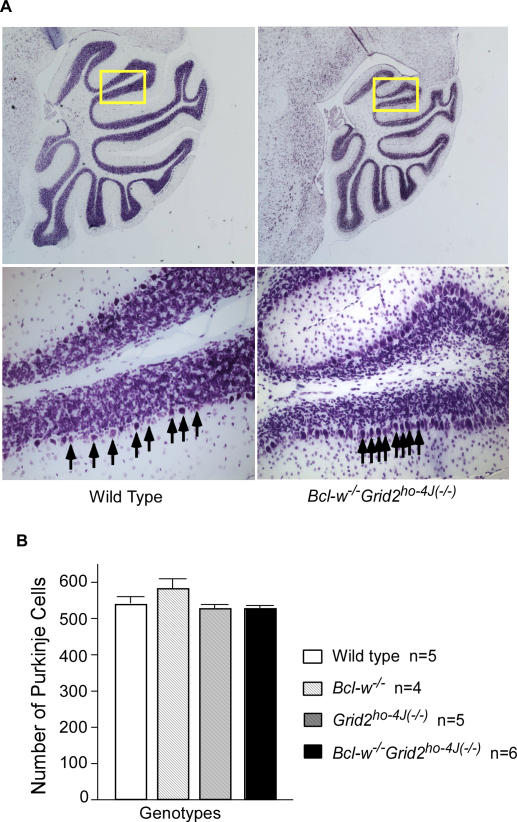
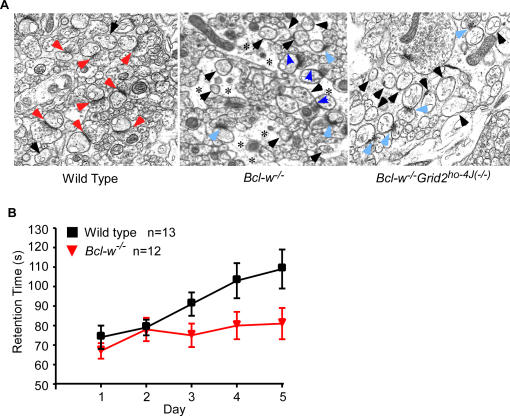
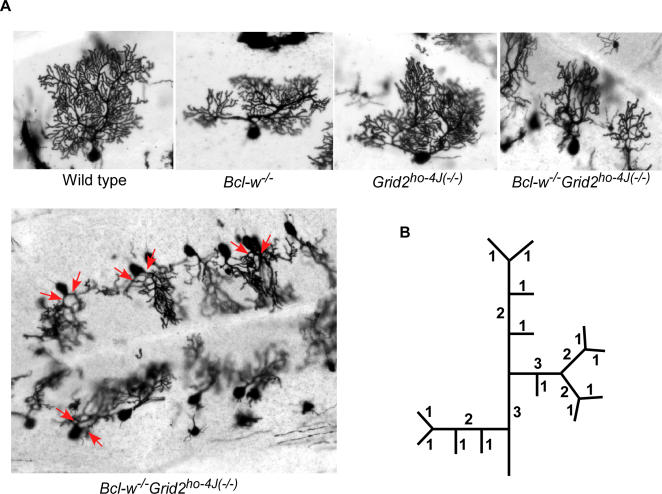
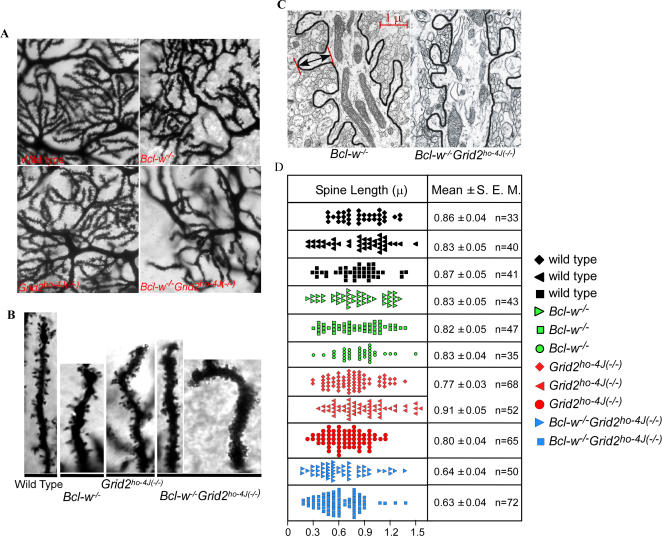
Bcl-w belongs to the prosurvival group of the Bcl-2 family, while the glutamate receptor delta2 (Grid2) is an excitatory receptor that is specifically expressed in Purkinje cells, and required for Purkinje cell synapse formation. A recently published result as well as our own findings have shown that Bcl-w can physically interact with an autophagy protein, Beclin1, which in turn has been shown previously to form a protein complex with the intracellular domain of Grid2 and an adaptor protein, nPIST. This suggests that Bcl-w and Grid2 might interact genetically to regulate mitochondria, autophagy, and neuronal function. In this study, we investigated this genetic interaction of Bcl-w and Grid2 through analysis of single and double mutant mice of these two proteins using a combination of histological and behavior tests. It was found that Bcl-w does not control the cell number in mouse brain, but promotes what is likely to be the mitochondrial fission in Purkinje cell dendrites, and is required for synapse formation and motor learning in cerebellum, and that Grid2 has similar phenotypes. Mice carrying the double mutations of these two genes had synergistic effects including extremely long mitochondria in Purkinje cell dendrites, and strongly aberrant Purkinje cell dendrites, spines, and synapses, and severely ataxic behavior. Bcl-w and Grid2 mutations were not found to influence the basal autophagy that is required for Purkinje cell survival, thus resulting in these phenotypes. Our results demonstrate that Bcl-w and Grid2 are two critical proteins acting in distinct pathways to regulate mitochondrial morphogenesis and control Purkinje cell dendrite development and synapse formation. We propose that the mitochondrial fission occurring during neuronal growth might be critically important for dendrite development and synapse formation, and that it can be regulated coordinately by multiple pathways including Bcl-2 and glutamate receptor family members.


Conflict of interest statement

The authors have declared that no competing interests exist.

Figures

Figure 1
Figure 1. Mitochondrial Morphology Abnormality in Purkinje Cell Dendrites of Bcl-w−/−, Grid2−/−, and Bcl-w−/−Grid2 ho−4J/(−/−) Mice.
(A) Electronmicrograph to show the morphology of mitochondria in dendritic track in wild type, Bcl-w−/−, Grid2−/−, and Bcl-w−/−Grid2 ho−4J/(−/−) mice. Black arrows indicate dendritic spines, orange arrowhead the broken end of mitochondria, indicating mitochondria transiting out of section plate, and the blue arrows the constriction sites on mitochondria. (B) Histograph showing the length of mitochondria in Purkinje cell dendrites. Each lane represents one mouse. Square indicates wild type mice, solid triangle the Bcl-w−/− mice, solid dot the Grid2−/−mice, and diamond the Bcl-w−/−Grid2 ho−4J(−/−) mice. A student t-test was performed on mitochondrial length among all listed mice. Three wild type mice are significantly different from all other mice in mitochondria length, p<0.0001. The mitochondrial lengths in two Bcl-w−/−Grid2ho−4J(−/−) mice are significantly different from that in single knockout mice, p<0.05. “n” indicates the number of mitochondria collected. (C) Semi-thin sections illustrating the presence of mitochondria in dendritic tracks in wild type, Bcl-w−/−, Grid2−/−, and Bcl-w−/−Grid2 ho−4J(−/−) mice. The orange arrows point at mitochondria in Purkinje cell dendrites.
Figure 2
Figure 2. No Loss of Purkinje Cells in Bcl-w−/−, Grid2 ho−4J(−/−) or Bcl-w−/−Grid2 ho−4J(−/−) Double Mutant Mice.
(A) Nissil stain showing the smaller cerebellum (top panel) and overcrowded Purkinje cell layer (bottom panel) in a Bcl-w−/−Grid2 ho−4J(−/−) double mutant mouse (right panels) relative to wild type mouse (left panels). (B) Bar graph demonstrating the average Purkinje cell numbers obtained from wild type, Bcl-w−/−, Grid2 ho−4J(−/−), and Bcl-w−/−Grid2 ho−4J(−/−) mutant mice. Statistical analysis indicated no significant difference among Purkinje cell numbers of these genotypes. Error bars represent standard error of the mean.
Figure 3
Figure 3. Abnormal Synapses and Rotarod Defect in Bcl-w−/− Mice.
(A) Electromicrographs of synapses in wild type, Bcl-w−/−, and Bcl-w−/−Grid2ho−4J(−/−) mice. Red arrows indicate the normal synapses, light blue arrows the defective synapses with thick postsynaptic density, dark blue arrowheads the synapses with mismatched pre- and post- synaptic elements, black arrows the naked spines, asterisks the swelling Bergmann Glia encompassing Purkinje cells and synapses. (B) The learning profiles as represented by the average retention time for mice to stay on accelerating Rotarod bar during five consecutive testing days. The Bcl-w−/− mice had significant difference in retention time from that of wild type mice in day 2, 3, 4, and 5, P<0.001.
Figure 4
Figure 4. Golgi Stains Illustrating Dendritic Abnormalities in Bcl-w−/−Grid2 ho−4J(−/−) Double Mutant Mice.
(A) Golgi stain showing the profile of Purkinje cell dendritic trees in wild type, Bcl-w−/−, Grid2ho−4J(−/−), and Bcl-w−/−Grid2ho−4J(−/−) mice (top panel). Low magnification view of one partial folia in the Bcl-w−/−Grid2 ho−4J(−/−) cerebellum illustrating several affected Purkinje cells (lower panel). Red arrows indicate two primary dendritic branches extended from the Purkinje cell soma. (B) The Strahler order of method. This method was designed to assess topological features of dendrites by assigning a relative order of magnitude to each dendritic branch. The number of Strahler orders, combined with the number of branches in each of these orders, is a quantitative measure of the complexity of a dendritic tree. The tip branches are counted as “order 1”, and two “order 1” branches meet to form the “order 2” branch, etc.
Figure 5
Figure 5. Golgi Stains Illustrating Dendritic Spine Abnormalities in Bcl-w−/−Grid2 ho−4J(−/−) Double Mutant Mice.
(A) Golgi stain showing Purkinje dendritic branches and spines in wild type, Bcl-w−/−, Grid2 ho−4J(−/−), and Bcl-w−/−Grid2 ho−4J(−/−) mice. Note the difficulty in visualizing dendritic spines decorating the dendrites of Bcl-w−/−Grid2 ho−4J(−/−) mice. (B) High resolution photographs of terminal dendritic branches as visualized using Golgi stain indicate shorter and more crowded spines in Bcl-w−/−Grid2 ho−4J(−/−) mice. (C) Electron micrograph illustrating the profiles of dendritic spines in the wild type (left panel) and the Bcl-w−/−Grid ho−4J(−/−) Purkinje cells (right panel). Only those spines that connected to the dendrites and whose profiles clearly delineated both the head and the neck were measured. Note the stubby appearance of the spines present on the double mutant Purkinje cells. Arrow and bars demonstrate the measurement of the spine length. (D) Histogram demonstrating the distribution of spine lengths based on electron micrographic measurements for each genotype. Each color represents one genotype, and each lane one mouse. Student t-test statistics was applied to calculate significant differences in spine length between all pairs of samples. The spine lengths in Bcl-w−/−Grid2ho−4J(−/−) mice were significantly different from those measured in all other genotype samples, p≤0.001, and there were no significant difference among spine lengths from wild type and single mutant mice.

References

    1. Polyakov VY, Soukhomlinova MY, Fais D. Fusion, fragmentation, and fission of mitochondria. Biochemistry (Mosc) 2003;68:838–849. - PubMed
    1. Okamoto K, Shaw JM. Mitochondrial morphology and dynamics in yeast and multicellular eukaryotes. Annu Rev Genet. 2005;39:503–536. - PubMed
    1. Chan DC. Mitochondrial Fusion and Fission in Mammals. Annu Rev Cell Dev Biol. 2006;22:79–99. - PubMed
    1. Alberts B, Johnson A, Lewis J, Raff M, Roberts K, Walter P. Molecular Biology of the Cell (4th edition) GS Garland Science Taylor & Francis group; 2002. pp. 808–821.
    1. Youle RJ, Karbowski M. Mitochondrial fission in apoptosis. Nat Rev Mol Cell Biol. 2005;6:657–663. - PubMed

Publication types

MeSH terms