. 2008 Jul;118(7):2427-37.
doi: 10.1172/JCI35017.

Chronic lymphocytic leukemia T cells show impaired immunological synapse formation that can be reversed with an immunomodulating drug

Affiliations

Chronic lymphocytic leukemia T cells show impaired immunological synapse formation that can be reversed with an immunomodulating drug

Alan G Ramsay et al. J Clin Invest. 2008 Jul.

Abstract

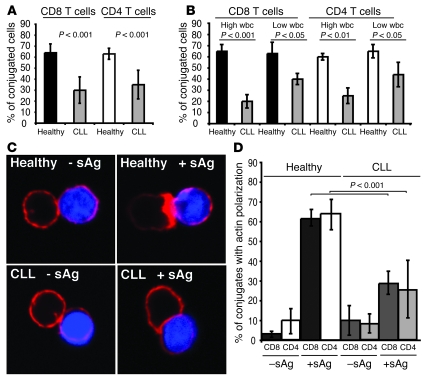
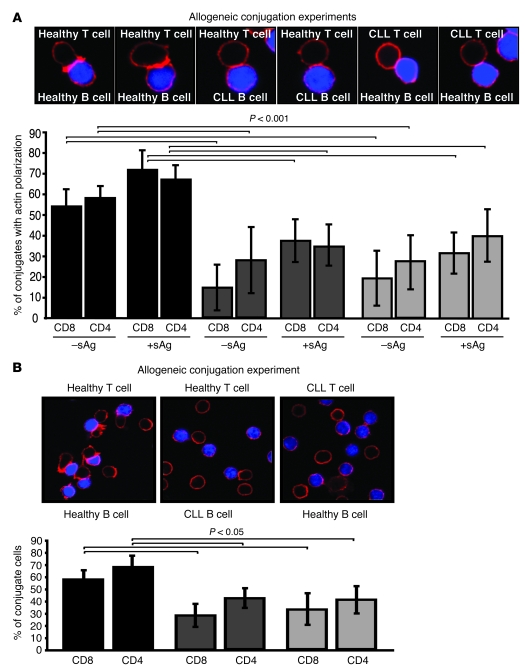
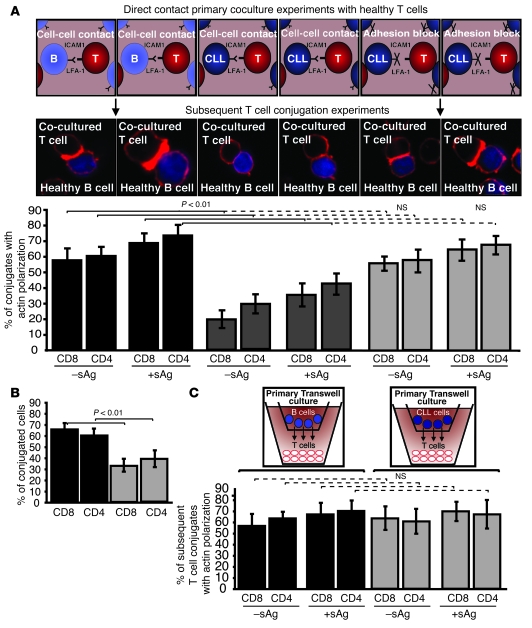
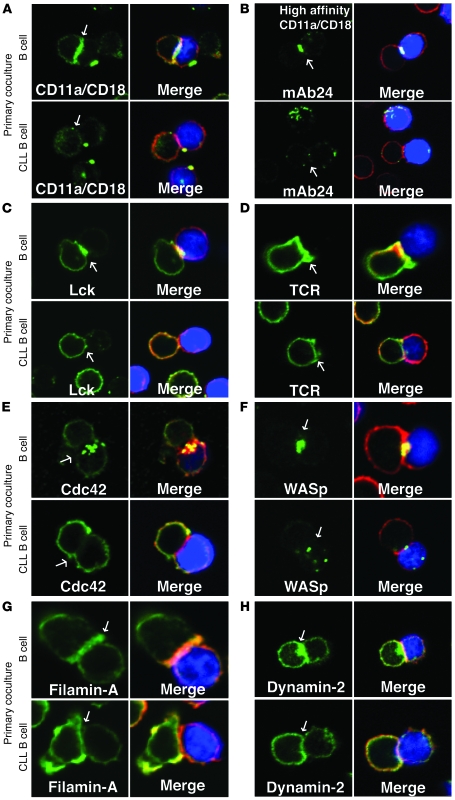
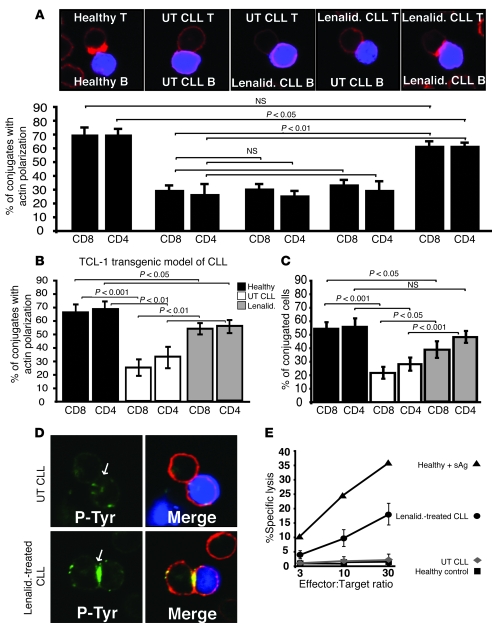
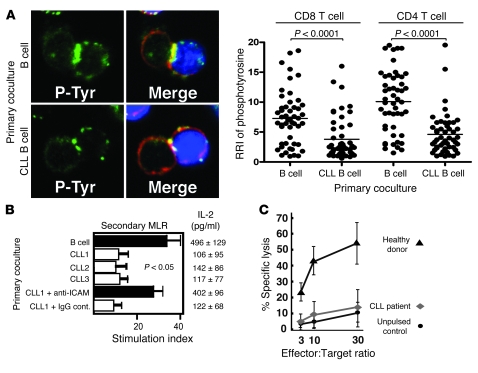
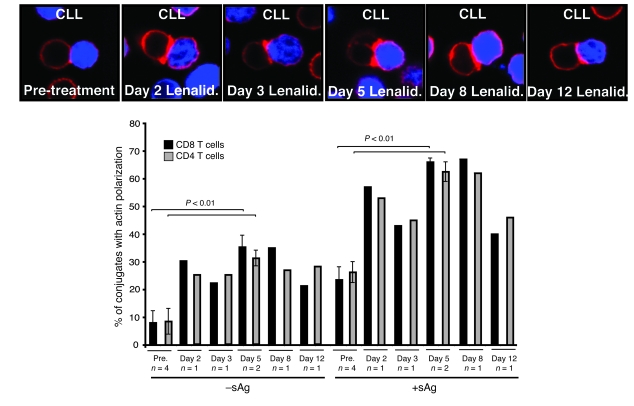
Cancer is associated with immune deficiency, but the biologic basis of this is poorly defined. Here we demonstrate that impaired actin polymerization results in CD4+ and CD8+ T cells from patients with chronic lymphocytic leukemia (CLL) exhibiting defective immunological synapse formation with APCs. Although this synapse dysfunction was in part a result of the CLL cells having poor APC function, defective actin polymerization was also identified in T cells from patients with CLL. We further demonstrate that, following contact with CLL cells, defects in immune synapse formation were induced in healthy allogeneic T cells. This required direct contact and was inhibited by blocking adhesion molecules on CLL B cells. In T cells from patients with CLL and in T cells from healthy individuals that had been in contact with CLL cells, recruitment of key regulatory proteins to the immune synapse was inhibited. Treatment of autologous T cells and CLL cells with the immunomodulating drug lenalidomide resulted in improved synapse formation. These results define what we believe to be a novel immune dysfunction in T cells from patients with CLL that has implications for both autologous and allogeneic immunotherapy approaches and identifies repair of immune synapse defects as an essential step in improving cancer immunotherapy approaches.


Figures

Figure 1
Figure 1. CLL patients have impaired T cell immune synapse formation.
(A) T cell conjugates formed between T cells from CLL patients or age-matched healthy donors and sAg-pulsed autologous CLL B cells or healthy B cells, respectively, were scored by visual counting using a confocal microscope. Each data set shows the mean ± SD from 6 independent experiments, with 50 random T cells analyzed per experiment. (B) Autologous conjugate experiments were performed as in A, comparing CLL patients with low (less than 20 mm3) absolute wbc versus high wbc (20 mm3 or more) with age-matched healthy donor cell conjugates. Each data set shows the mean ± SD from 3 independent experiments, with 50 random T cells analyzed per experiment. (C) T cells from CLL patients or age-matched healthy donors were allowed to conjugate with autologous CLL cells or healthy B cells, respectively, with or without sAg (blue, CMAC dyed). Conjugates were then fixed and stained with rhodamine phalloidin to detect F-actin (red). Note the lack of F-actin enrichment at the synapse site in T cells from CLL even in the presence of sAg-pulsed CLL cells. Original magnification, ×63. (D) Conjugates were selected at random for imaging and were scored for accumulation of F-actin at the immune synapse. Each data set shows the mean ± SD from 9 independent patient experiments, with 50 conjugates analyzed per experiment.
Figure 2
Figure 2. Defects in CLL B cells and T cells contribute to decreased immunological synapse formation.
(A) Conjugates from mixed allogeneic experiments using T cells or CLL B cells from leukemic patients with healthy allogeneic cells were selected at random for imaging and scored for accumulation of F-actin (red) at the immune synapse (with or without sAg-pulsed APCs, blue). As controls, healthy T cells were conjugated with allogeneic healthy B cells. Data are the mean ± SD from 6 independent experiments, with 50 conjugates analyzed per experiment. (B) T cell conjugates from mixed allogeneic experiments (sAg-pulsed CLL B or healthy B cells, blue) were scored by visual counting using a confocal microscope. Each data set shows the mean ± SD from 6 independent experiments, with 50 random T cells analyzed per experiment. Original magnification, ×63.
Figure 3
Figure 3. CLL B cells induce defective immunological synapse formation in healthy allogeneic T cells by direct cell contact.
(A) Healthy T cells (T) were cocultured for 48 h with either healthy allogeneic B cells (B) or allogeneic CLL B cells and subsequently used in conjugation assays with or without sAg-pulsed third-party allogeneic healthy donor B cells (APCs, stained blue). Conjugates were selected at random for imaging and were scored for accumulation of F-actin (stained red) at the immune synapse. Note the prevention of the synapse defect when cell adhesion was blocked by pretreatment of CLL B cells with anti–ICAM-1 monoclonal antibody prior to primary coculture with healthy T cells. Data are the mean ± SD from 3 independent experiments, with 50 conjugates analyzed per experiment. The confocal images shown are CD8+ T cells. Original magnification, ×63. (B) T cell conjugates from A were scored by visual counting using a confocal microscope. Each data set shows the mean ± SD from 3 independent experiments, with 50 random T cells analyzed per experiment. (C) Healthy T cells cocultured for 48 h with either healthy allogeneic B cells or allogeneic CLL B cells in transwell culture plates and subsequently used in conjugation assays with or without sAg-pulsed third-party allogeneic healthy donor B cells (APCs). Conjugates were selected at random for imaging and were scored for accumulation of F-actin at the immune synapse. Data are the mean ± SD from 3 independent experiments, with 50 conjugates analyzed per experiment.
Figure 4
Figure 4. CLL tumor cells induce defective recruitment of signaling molecules to the immune synapse.
Healthy CD8+ and CD4+ T cells were cocultured (primary coculture) for 48 h in direct contact with either healthy allogeneic B cells or allogeneic CLL B cells and subsequently used in conjugation assays with sAg-pulsed third-party allogeneic healthy donor B cells (APCs, blue). T cell conjugates formed were analyzed by immunofluorescence and confocal microscopy (F-actin was stained red using rhodamine phalloidin). Images shown are representative of evaluation of 150 conjugates from 3 independent experiments stained green for (A) LFA-1, (B) high-affinity LFA-1 (mAb24), (C) Lck (5-min conjugation time), (D) TCR (nonpermeabilizing conditions), (E) Cdc42, (F) WASp, (G) filamin-A, and (H) dynamin-2. Quantitative image analysis of protein accumulation (green) at the immunological synapse is shown in Supplemental Figure 2. Arrows denote protein localization at the T cell–APC synapse site. Colocalization of proteins in the merged images is shown in yellow. Original magnification, ×63.
Figure 6
Figure 6. Treatment of patient and Eμ-TCL1 mouse cells with lenalidomide significantly enhances immunological synapse formation.
Autologous T cell–sAg–pulsed CLL B cell conjugates from untreated (UT) or lenalidomide-treated (Lenalid.) CLL patient (A) or Eμ-TCL1 mouse cells (B) were selected at random for imaging and scored for accumulation of F-actin (red) at the immune synapse. As controls (healthy), autologous age-matched healthy donor or wild-type mice cells were used. Data are the mean ± SD from 3 independent experiments, with 50 conjugates analyzed per experiment. The confocal images shown are CD4+ human T cells. (C) Autologous T cell–sAg–pulsed CLL B cell conjugates from untreated CLL or lenalidomide-treated Eμ-TCL1 mouse cells were scored by visual counting using a confocal microscope. As controls, age-matched wild-type mice cells were used. Data are the mean ± SD from 3 independent experiments, with 50 random T cells analyzed per experiment. (D) Autologous T cell–sAg–pulsed CLL B cell (blue) conjugates from untreated or lenalidomide-treated patient CLL B and CLL T cells were stained for phosphotyrosine (green) and F-actin (red) using immunofluorescence and confocal microscopy. Images shown are representative of evaluation of 150 conjugates from 3 independent experiments. Arrows indicate protein localization at the T cell–APC synapse site. (E) Autologous cytotoxicity of CLL B cells was compared between untreated and lenalidomide-treated patient CLL B and CLL CD8+ T cells. Killing was assessed at the effector/target ratios shown. Data are mean ± SD from 6 independent CLL patient experiments. Autologous healthy donor cells were used as controls (with or without sAg-pulsed B cells). Original magnification, ×63.
Figure 5
Figure 5. CLL T cells have reduced activation and effector function.
(A) Healthy CD8+ and CD4+ T cells were cocultured for 48 h as described in Figure 4. T cell conjugates formed during 5 min were fixed, permeabilized, and stained with anti-phosphotyrosine Ab (green) and rhodamine phalloidin (red). Quantitative image analysis (relative recruitment index [RRI]) of phosphotyrosine accumulation at the immunological synapse is shown, representative of evaluation of 150 conjugates from 3 independent experiments (50 conjugates analyzed per experiment), with the mean value shown as a black bar. Original magnification, ×63. (B) Healthy CD3+ T cells were first cocultured in direct contact with allogeneic healthy B cells or 3 different CLL B cells (CLL 1-3) with the addition of anti–ICAM-1 monoclonal antibody or isotype control IgG, and then were used in secondary MLRs with third-party allogeneic PBMCs as stimulators. [3H]-thymidine incorporation was assessed for the last 16 h of a 3-d culture. The stimulation index was calculated as cpm of T cells with stimulator cells/cpm of T cells alone. Results are the mean stimulation index ± SD from 5 independent healthy donor CD3+ T cells. IL-2 was assessed by ELISA, and values represent the mean ± SD from 5 independent healthy donor CD3+ T cells tested. (C) HLA-A*0201–expressing CD8+ cells were stimulated in vitro with DCs pulsed with immunoglobulin heavy chain–derived (IgVH-derived) peptide TLYLQMNSL weekly for 4 wk, and killing of peptide-pulsed H2 cells was assessed at the effector/target ratios shown. The results are the mean ± SD from 6 independent CLL patient and healthy donor experiments.
Figure 7
Figure 7. In vivo treatment with lenalidomide enhances F-actin immune synapse formation.
Autologous T cell–CLL B cell (CLL B cells stained blue) conjugates (with or without sAg) from 4 patients before and after treatment with lenalidomide (Days 2, 3, 5, 8, and 12) were selected at random for imaging and scored for accumulation of F-actin (red) at the immune synapse. Fifty conjugates were analyzed per experiment. Original magnification, ×63.

Similar articles

Cited by

References

    1. Dunn G.P., Bruce A.T., Ikeda H., Old L.J., Schreiber R.D. Cancer immunoediting: from immunosurveillance to tumor escape. Nat. Immunol. 2002;3:991–998. doi: 10.1038/ni1102-991. - DOI - PubMed
    1. Dunn G.P., Old L.J., Schreiber R.D. The three Es of cancer immunoediting. Annu. Rev. Immunol. 2004;22:329–360. doi: 10.1146/annurev.immunol.22.012703.104803. - DOI - PubMed
    1. Swann J.B., Smyth M.J. Immune surveillance of tumors. J. Clin. Invest. 2007;117:1137–1146. doi: 10.1172/JCI31405. - DOI - PMC - PubMed
    1. Bhardwaj N. Harnessing the immune system to treat cancer. J. Clin. Invest. 2007;117:1130–1136. doi: 10.1172/JCI32136. - DOI - PMC - PubMed
    1. Krackhardt A.M., et al. Identification of tumor-associated antigens in chronic lymphocytic leukemia by SEREX. Blood. 2002;100:2123–2131. doi: 10.1182/blood-2002-02-0513. - DOI - PubMed

Publication types

MeSH terms