Case Reports
. 2008 Jul;118(7):2552-61.
doi: 10.1172/JCI35337.

Fever-induced QTc prolongation and ventricular arrhythmias in individuals with type 2 congenital long QT syndrome

Affiliations
Case Reports

Fever-induced QTc prolongation and ventricular arrhythmias in individuals with type 2 congenital long QT syndrome

Ahmad S Amin et al. J Clin Invest. 2008 Jul.

Abstract

Type 2 congenital long QT syndrome (LQT-2) is linked to mutations in the human ether a-go-go-related gene (HERG) and is characterized by rate-corrected QT interval (QTc) prolongation, ventricular arrhythmias, syncope, and sudden death. Recognized triggers of these cardiac events include emotional and acoustic stimuli. Here we investigated the repeated occurrence of fever-induced polymorphic ventricular tachycardia and ventricular fibrillation in 2 LQT-2 patients with A558P missense mutation in HERG. ECG analysis showed increased QTc with fever in both patients. WT, A558P, and WT+A558P HERG were expressed heterologously in HEK293 cells and were studied using biochemical and electrophysiological techniques. A558P proteins showed a trafficking-deficient phenotype. WT+A558P coexpression caused a dominant-negative effect, selectively accelerated the rate of channel inactivation, and reduced the temperature-dependent increase in the WT current. Thus, the WT+A558P current did not increase to the same extent as the WT current, leading to larger current density differences at higher temperatures. A similar temperature-dependent phenotype was seen for coexpression of the trafficking-deficient LQT-2 F640V mutation. We postulate that the weak increase in the HERG current density in WT-mutant coassembled channels contributes to the development of QTc prolongation and arrhythmias at febrile temperatures and suggest that fever is a potential trigger of life-threatening arrhythmias in LQT-2 patients.


Figures
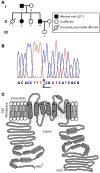
Figure 1
Figure 1. Genetic and sequence analysis of the A558P HERG mutation.
(A) Pedigree of the family with the A558P HERG mutation. Mutation analysis in 10 siblings of generation I identified only 1 patient (I-1) as carrier of the A558P mutation (see ref. 12). (B) DNA sequence analysis displaying the G to C substitution at position 1,672 of exon 7. (C) Cartoon of a single subunit of the functional HERG channel, illustrating its 6 transmembrane segments and the location of the A558P mutation as a red dot in the S5 segment. The pore region is located between the S5 and S6 segments. The cylinders and the bars represent putative α helices and β sheets, respectively. Four such subunits coassemble in a tetrameric structure to form 1 functional HERG channel in the cell membrane.
Figure 2
Figure 2. Fever-associated QTc prolongation and TdP.
(A) Lead II of the ECG of patient I-1 on admission, showing an abnormal repolarization profile and prolonged QTc duration of 540 ms (body temperature, 39.7°C; standard calibration, 25 mm/sec and 10 mm/mV). (B) Two episodes of TdP in patient I-1 during fever. Both episodes are pause-dependent, as is typical for LQT-2 (13). The middle trace shows the pause-dependent onset of multiform ectopic beats (lead II). (C) The left panel shows QTc durations in LQT-2 patients I-1 and II-4 in relation to body temperature. Numbers next to the circles indicate serum K+ levels (mmol/l). Solid lines represent linear fits. In both patients, QTc durations increased with rising body temperature. The slopes of the fits in patient I-1 (14 ms/°C) and patient II-4 (16 ms/°C) are not significantly different. The right panel shows QTc durations in LQT-2 patients compared with control patients in relation to body temperature. Solid lines represent the regression line through both groups based on the common slopes. The common slope of the fit through the LQT-2 patients (15 ms/°C) differs significantly from that of control patients (–6 ms/°C).
Figure 3
Figure 3. Trafficking-deficient phenotype of the A558P HERG mutation and attempts to correct the deficient trafficking.
(A) Representative western blot of cells expressing WT and A558P HERG protein (n = 3). WT shows both mature complexly glycosylated (155 kDa) and immature core-glycosylated (135 kDa) protein bands. A558P displays only the immature band, representative for trafficking-deficient mutant HERG proteins. Cells were cultured at 37°C. (B) Representative whole-cell Itail traces of WT or A558P-expressing cells. WT channels display typical Itail, while only small amplitude Itail could be recorded from cells expressing A558P. Cells were cultured at 37°C. Scale bars: 1 nA, 50 ms. (C and D) Representative western blot (n = 3) and corresponding Itail of WT and A558P following culture at 27°C or incubation for 24 hours with 10-μmol/l E-4031 (culture at 37°C). Only incubation with E-4031 could minimally correct the deficient trafficking. Scale is as in B. (E) Average Itail densities. All Itail were measured at 23°C. n, number of cells. *P < 0.05 compared with WT Itail; #P < 0.05 compared with A558P Itail.
Figure 4
Figure 4. Dominant-negative effect of A558P HERG protein.
(A) Representative western blot of cells transfected with 3-μg WT HERG cDNA, 1.5-μg WT cDNA plus 1.5-μg pCDNA3 vector, or 1.5-μg WT plus 1.5-μg A558P cDNA (n = 3). Cells transfected with 3-μg or 1.5-μg WT cDNA show both immature and mature protein bands. Cells coexpressing WT+A558P show the immature band with minimal or no mature protein band. Cells were cultured at 37°C. (B) Representative whole-cell Itail. Scale bars: 1 nA, 50 ms. (C) Average Itail densities. Cells were cultured at 37°C, and all Itail were measured at 23°C. *P < 0.05 compared with 3-μg WT Itail; #P < 0.05 compared with 1.5-μg WT Itail.
Figure 5
Figure 5. Effect of temperature on current density.
(A) Representative Itail for WT and WT+A558P mutant channels first measured at 23°C, repeated at 35°C, and then at 40°C for each cell. Scale bars for representative Itail: 1 nA, 1 s; scale bars for enlarged WT Itail: 2 nA, 0.25 s; scale bars for enlarged WT+A558P Itail: 0.5 nA, 0.25 s. Itail increased for both channels with rising temperature. (B) Average Itail densities at 23°C, 35°C, and 40°C. Compared with WT, the temperature-dependent increase of Itail density was significantly smaller for WT+A558P and WT+F640V channels. Cells were cultured at 37°C. (C) Average differences between WT and WT+A558P or WT+F640V Itail densities at 23°C, 35°C, and 40°C. Differences in Itail densities increased with rising temperature. *P < 0.001 compared with 23°C; #P < 0.001 compared with 35°C.
Figure 6
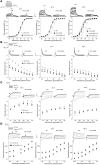
Figure 6. Effect of temperature on gating properties: activation, inactivation, recovery from inactivation, and deactivation.
For each parameter (portion of) representative current traces of WT and WT+A558P channels at 23°C, 35°C, and 40°C within the same cell are shown. Voltage-clamp protocols are shown in the insets. Cells were cultured at 37°C. (A) For activation, the scale bars for representative current traces: 1 nA, 1 s. Arrows indicate Itail. The mean Itail normalized to maximum value are plotted as a function of the prepulse voltage. The solid lines represent Boltzmann equation fits. (B) For inactivation, the scale bars for representative current traces: 4 nA, 10 ms. Arrows indicate channel inactivation. Mean time constants of inactivation are plotted as a function of test voltage. (C) For recovery from inactivation, the scale for representative current traces: 1 nA, 10 ms. Arrows indicate channel recovery. Mean time constants of recovery from inactivation are plotted as a function of test voltage. (D) For deactivation, the scale bars for representative current traces: 1 nA, 50 ms. Arrows indicate channel deactivation. Mean time constants of deactivation are plotted as a function of test voltage. *P < 0.05 compared with WT (ANOVA). See Results for details.

Similar articles

Cited by

References

    1. Roden D.M. Clinical practice. Long QT syndrome. N. Engl. J. Med. 2008;358:169–176. doi: 10.1056/NEJMcp0706513. - DOI - PubMed
    1. January C.T., Gong Q., Zhou Z. Long QT syndrome: cellular basis and arrhythmia mechanism in LQT2. J. Cardiovasc. Electrophysiol. 2000;11:1413–1418. doi: 10.1046/j.1540-8167.2000.01413.x. - DOI - PubMed
    1. Sanguinetti M.C., Curran M.E., Spector P.S., Keating M.T. Spectrum of HERG K+ channel dysfunction in an inherited cardiac arrhythmia. . Proc. Natl. Acad. Sci. U. S. A. 1996;93:2208–2212. doi: 10.1073/pnas.93.5.2208. - DOI - PMC - PubMed
    1. MacKinnon R. Determination of the subunit stoichiometry of a voltage-activated potassium channel. Nature. . 1991;350:232–235. doi: 10.1038/350232a0. - DOI - PubMed
    1. Anderson C.L., et al. Most LQT2 mutations reduce Kv11.1 (hERG) current by a class 2 (trafficking-deficient) mechanism. Circulation. 2006;113:365–373. doi: 10.1161/CIRCULATIONAHA.105.570200. - DOI - PubMed

Publication types

MeSH terms

Substances