

Visualizing protease activity in living cells: from two dimensions to four dimensions
- PMID: 18551423
- PMCID: PMC3782287
- DOI: 10.1002/0471143030.cb0420s39
Visualizing protease activity in living cells: from two dimensions to four dimensions
Abstract
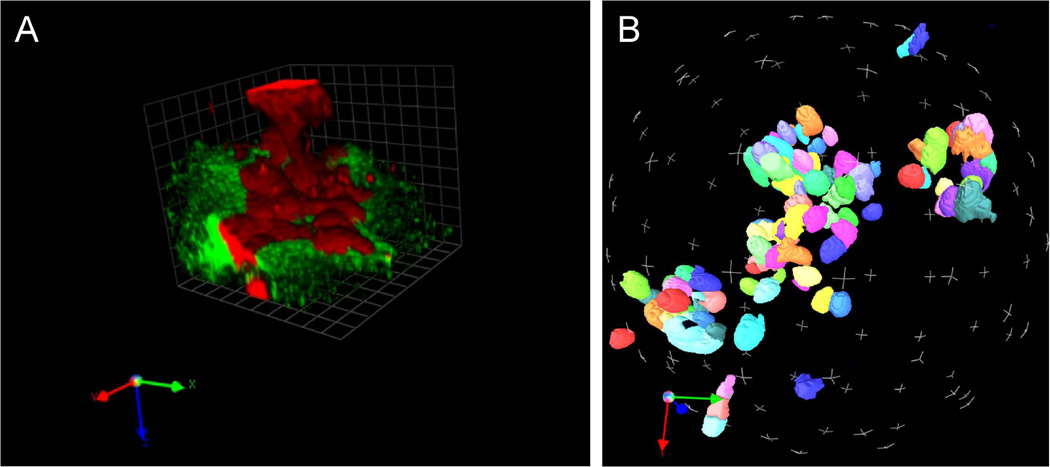
Proteolytic degradation of extracellular matrix (ECM) components by cells is an important metabolic activity as cells grow, remodel, and migrate through the ECM. The ability to analyze ECM degradation can be valuable in the study of developmental processes as well as pathologies, such as cancer. In this unit we describe an in vitro live cell-based method to image and quantitatively measure the degradation of ECM components by live cells. Cells are grown in the presence of fluorescent dye-quenched protein substrates (DQ-gelatin, DQ-collagen I, and DQ-collagen IV) that are mixed with protein matrices. Upon proteolytic cleavage, fluorescence is released that directly reflects the level of proteolysis by the cells. Using confocal microscopy and advanced imaging software, the fluorescence is detected and accurate measurements of proteolytic degradation in three and four dimensions can be assessed.
Copyright 2008 by John Wiley & Sons, Inc.
Figures


Similar articles
-
Functional imaging of proteolysis: stromal and inflammatory cells increase tumor proteolysis.Mol Imaging. 2003 Jul;2(3):159-75. doi: 10.1162/15353500200303136. Mol Imaging. 2003. PMID: 14649059
-
Imaging proteolysis by living human glioma cells.Biol Chem. 2001 May;382(5):785-8. doi: 10.1515/BC.2001.094. Biol Chem. 2001. PMID: 11517931
-
Modeling the cholesteatoma microenvironment: coculture of HaCaT keratinocytes with WS1 fibroblasts induces MMP-2 activation, invasive phenotype, and proteolysis of the extracellular matrix.Laryngoscope. 2007 Feb;117(2):313-8. doi: 10.1097/01.mlg.0000251164.26405.1a. Laryngoscope. 2007. PMID: 17204986
-
Functional imaging of pericellular proteolysis in cancer cell invasion.Biochimie. 2005 Mar-Apr;87(3-4):315-20. doi: 10.1016/j.biochi.2004.10.016. Biochimie. 2005. PMID: 15781318 Review.
-
Control of melanoma progression by various matrikines from basement membrane macromolecules.Crit Rev Oncol Hematol. 2004 Mar;49(3):221-33. doi: 10.1016/j.critrevonc.2003.09.006. Crit Rev Oncol Hematol. 2004. PMID: 15036262 Review.
Cited by
-
MAME models for 4D live-cell imaging of tumor: microenvironment interactions that impact malignant progression.J Vis Exp. 2012 Feb 17;(60):3661. doi: 10.3791/3661. J Vis Exp. 2012. PMID: 22371028 Free PMC article.
-
Live-Cell Imaging of Protease Activity: Assays to Screen Therapeutic Approaches.Methods Mol Biol. 2017;1574:215-225. doi: 10.1007/978-1-4939-6850-3_16. Methods Mol Biol. 2017. PMID: 28315254 Free PMC article.
-
3D collagen architecture regulates cell adhesion through degradability, thereby controlling metabolic and oxidative stress.Integr Biol (Camb). 2019 May 1;11(5):221-234. doi: 10.1093/intbio/zyz019. Integr Biol (Camb). 2019. PMID: 31251330 Free PMC article.
-
The Arf-like GTPase Arl8b is essential for three-dimensional invasive growth of prostate cancer in vitro and xenograft formation and growth in vivo.Oncotarget. 2016 May 24;7(21):31037-52. doi: 10.18632/oncotarget.8832. Oncotarget. 2016. PMID: 27105540 Free PMC article.
-
Novel Ex Vivo Zymography Approach for Assessment of Protease Activity in Tissues with Activatable Antibodies.Pharmaceutics. 2021 Sep 2;13(9):1390. doi: 10.3390/pharmaceutics13091390. Pharmaceutics. 2021. PMID: 34575469 Free PMC article.
References
-
- Cavallo-Medved D, Mai J, Dosescu J, Sameni M, Sloane BF. Caveolin-1 mediates the expression and localization of cathepsin B, pro-urokinase plasminogen activator and their cell-surface receptors in human colorectal carcinoma cells. J. Cell Sci. 2005;118:1493–1503. - PubMed
-
- Debnath J, Brugge JS. Modelling glandular epithelial cancers in three-dimensional cultures. Nat. Rev. Cancer. 2005;5:675–688. - PubMed
-
- Friedl P, Wolf K. Proteolytic and non-proteolytic migration of tumour cells and leucocytes. Biochem. Soc. Symp. 2003;70:277–285. - PubMed
-
- Menges DA, Ternullo DL, Tan-Wilson AL, Gal S. Continuous assay of proteases using a microtiter plate fluorescence reader. Anal. Biochem. 1997;254:144–147. - PubMed
Publication types
MeSH terms
Substances
Grants and funding
LinkOut - more resources
Full Text Sources
