

Review
doi: 10.1016/j.jchromb.2007.10.007.
Biochemical individuality reflected in chromatographic, electrophoretic and mass-spectrometric profiles
Affiliations
- PMID: 18551752
- PMCID: PMC2603028
- DOI: 10.1016/j.jchromb.2007.10.007
Item in Clipboard
Review
Biochemical individuality reflected in chromatographic, electrophoretic and mass-spectrometric profiles
J Chromatogr B Analyt Technol Biomed Life Sci.
.
Abstract
This review discusses the current trends in molecular profiling for the emerging systems biology applications. Historically, the methodological developments in separation science were coincident with the availability of new ionization techniques in mass spectrometry. Coupling miniaturized separation techniques with technologically-advanced MS instrumentation and the modern data processing capabilities are at the heart of current platforms for proteomics, glycomics and metabolomics. These are being featured here by the examples from quantitative proteomics, glycan mapping and metabolomic profiling of physiological fluids.
Figures
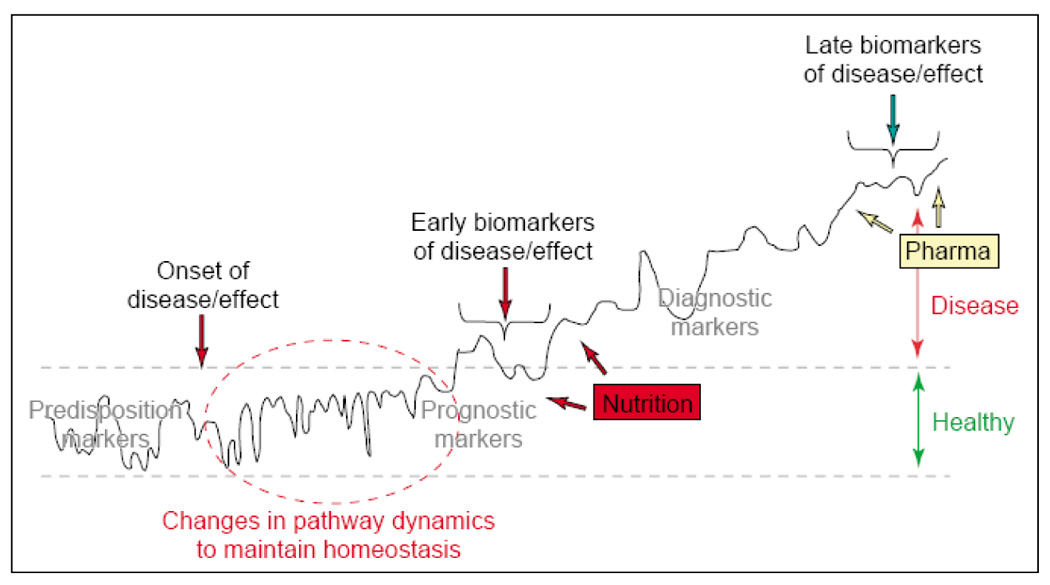
The development of disease from healthy (homeostasis within black-dotted lines) to sub-optimal health and eventually an overt disease state. Biomarker patterns (for graphical reasons represented as a single line) are essential to describe the changes from normality to dysfunction. Reproduced from [4] with permission.
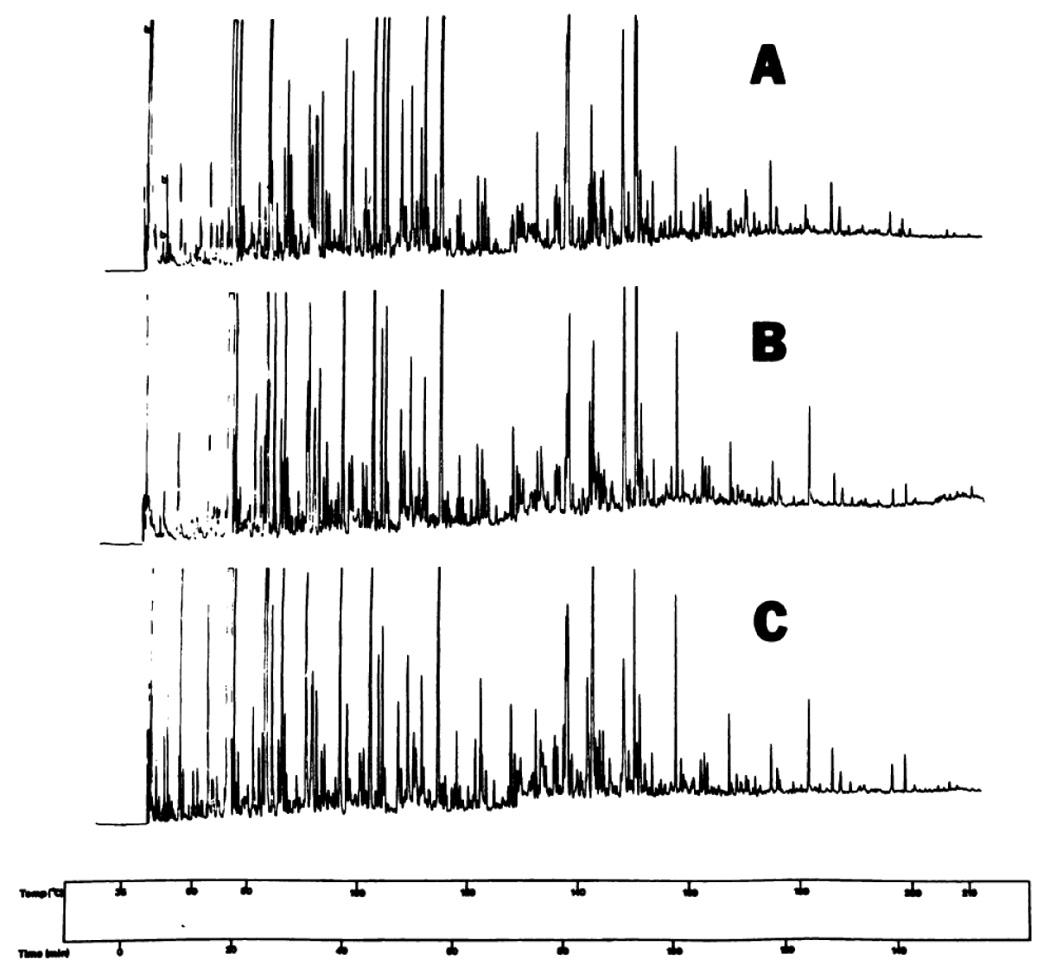
Chromatograms of urinary volatiles of a normal man. A and B are from 24-h, urines collected on different days and analyzed successively. B and C represent aliquots of the same urine, analyzed on different days. Peaks owing to the precolumn blank are designated as b in chromatogram A (left). Chromatographic conditions: 80 m × 0.31 mm (i.d.) glass capillary column coated with SF-96 silicone oil. Temp. (°C) time (min) are shown in all figures at top and bottom, respectively. Reproduced from [19] with permission.
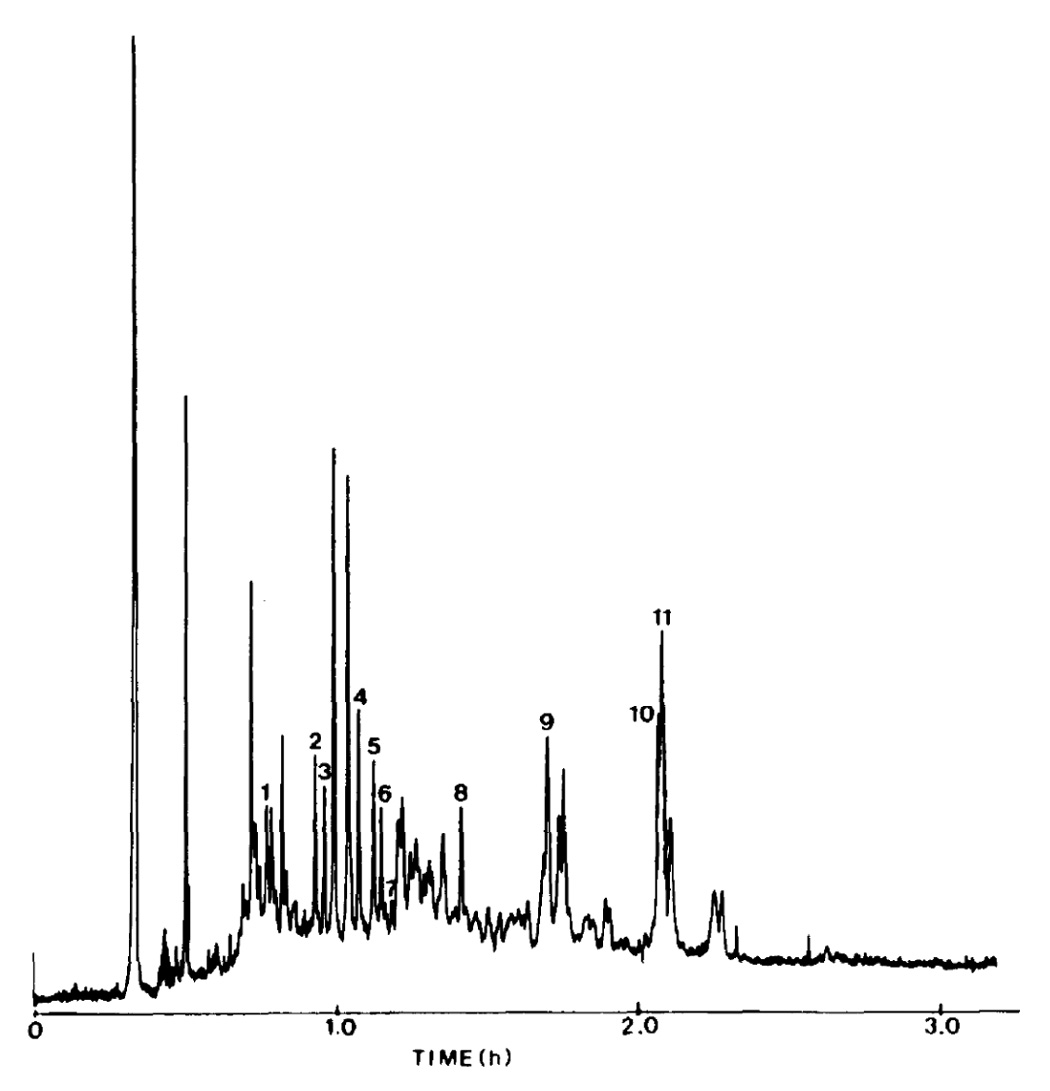
Chromatogram of solvolyzed plasma steroids. Chromatographic conditions: column, 2.25 m × 220 pm I.D. packed with 5-µm Spherisorb ODS; mobile phase: continuous gradient 75–100% aqueous acetonitrile (1.5 µl/min); injection, approximately 50 pg of each steroid was injected. Tentatively identified components: 1 = 5α-androstan-3α,11β-diol-17-one; 2 = 5β- androstan-3α,11β-diol-17-one; 3 = 5β-pregnane-3α, 11β,l7α,21-tetrol-20- one; 4 = 5β-pregnane-3α,17α,20β,21-tetrol-11-one; 5 = 5β-pregnane-3α,- 11β,17α-20α,21-pentol; 6 = 5β-pregnane-3α,17α,20α,2l-tetrol-11-one; 7 = 5β- pregnane-3α,11β,17α,20α,-21-pentol; 8 = 5α-androstan-3α-ol-17-one; 9 = 5- androstene-3β-ol-17-one; 10 = 5β-pregnane-3α,20α,21-triol; 11 = 5β- androstan-3α,17β-diol. Reproduced from [55] with permission.
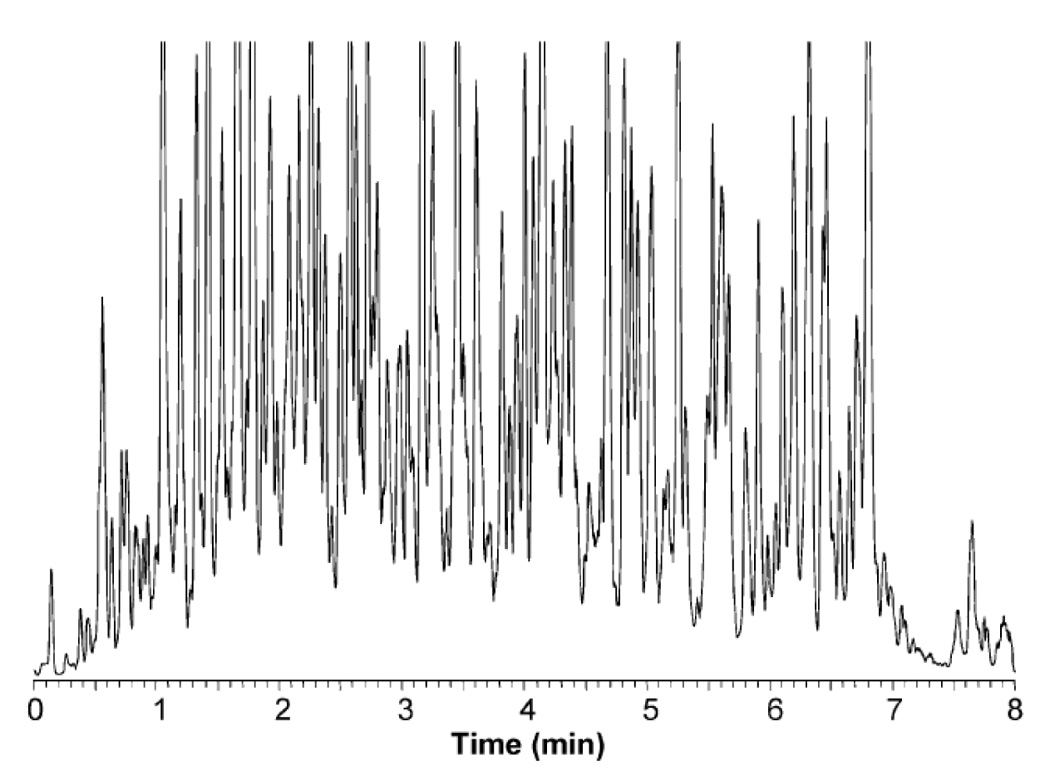
RPLC-MS base peak chromatogram the S. oneidensis global tryptic digest sample. Conditions: the 5-µL sample loop was used to load 1 µg of the sample onto a 20 cm × 50 µm i.d. packed capillary for LC separation. MS with an m/z range of 400–2000 was used for detection. Reproduced from [56] with permission and modification.
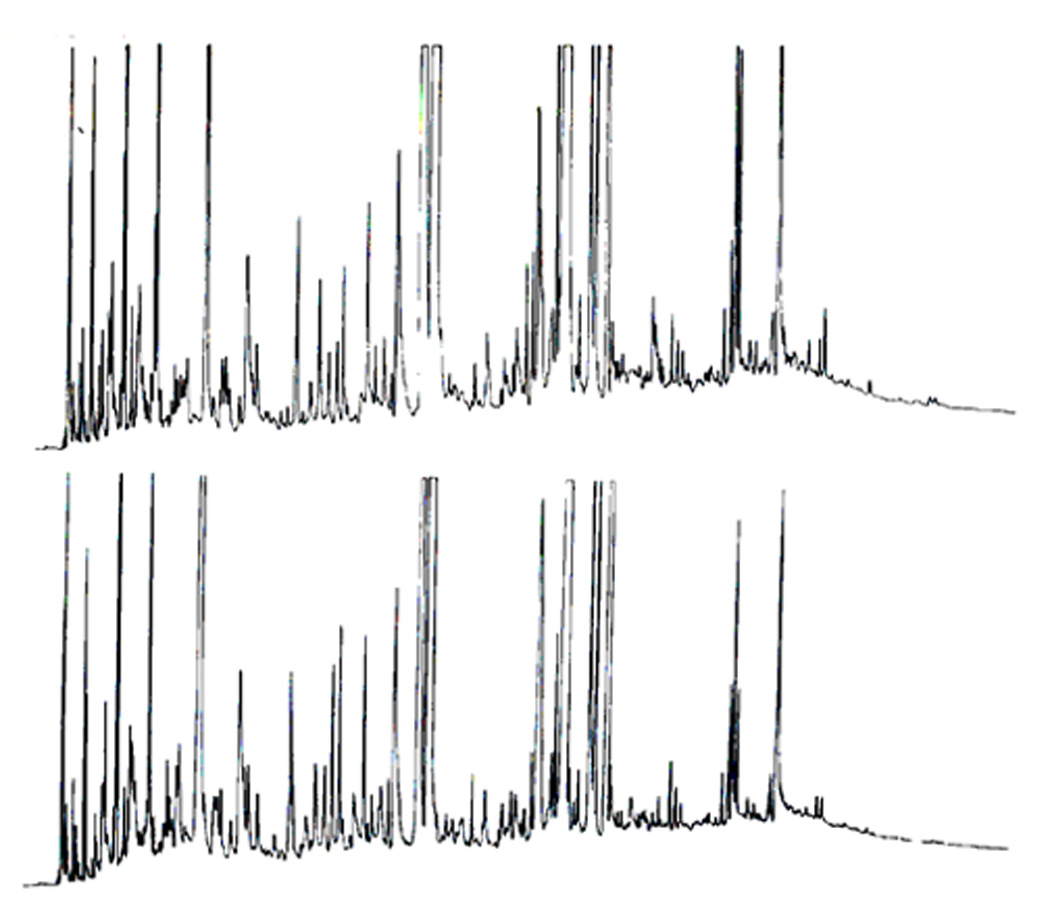
Volatile chromatographic profiles of identical twins maintained on an identical diet. Chromatograms were obtained on an SF-96 glass capillary column. Temperature programmed from 30–210°C at 2°C/min. Reproduced from [59].
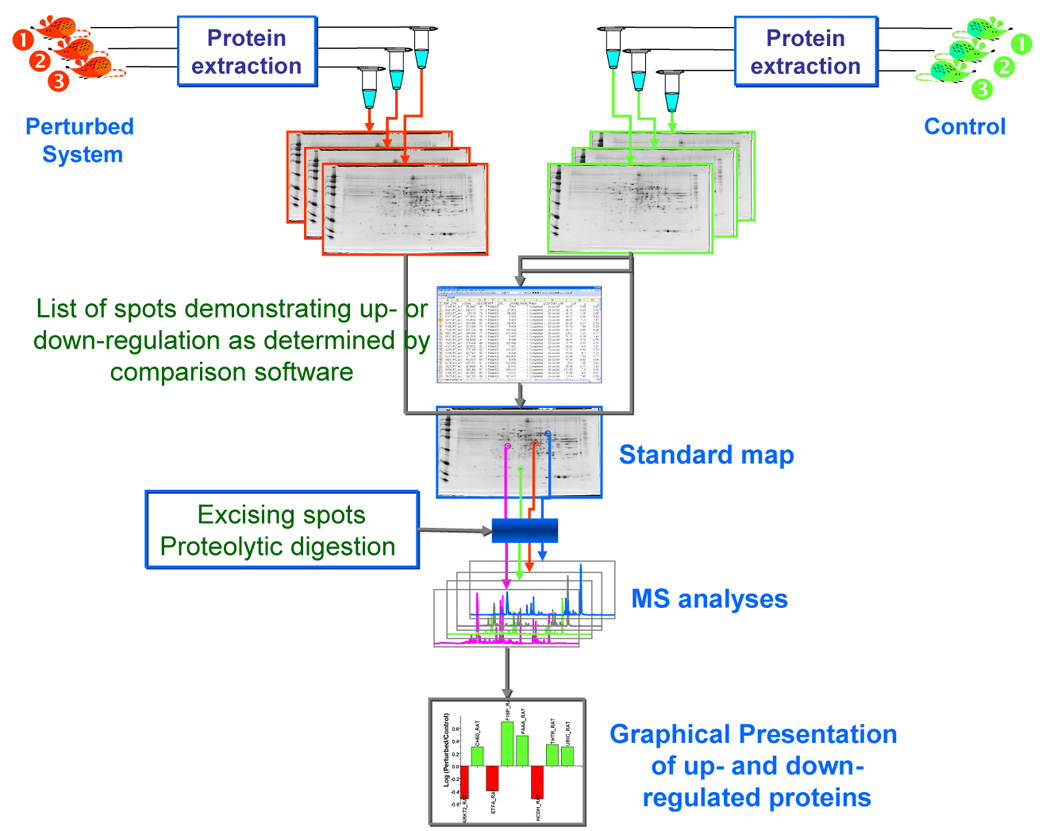
Flow chart depicting the different steps involved in generating sets of 2-D maps derived from control and perturbed biological systems. Proteome samples are extracted from both sets of animals and 2-DE is performed on each sample separately. After gel staining, the two sets of gels are compared using a specialized software such as PDQuest (BioRad, Hercules, CA). This comparison results in the generation of a list of up- and down-regulated spots which are subsequently excised and subjected to proteolytic digestion prior to MS identification. Finally, the identified proteins and their trends as a result of perturbation are graphically represented.
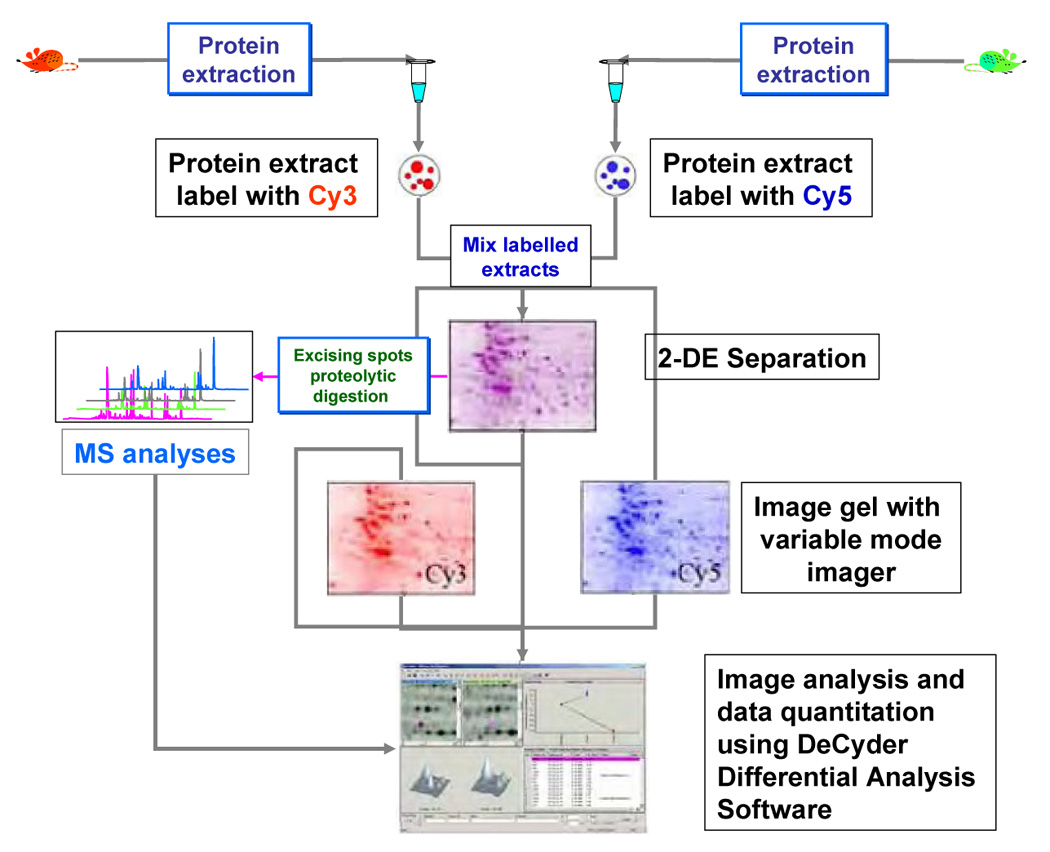
Flow chart depicting the different steps involved in generating of 2-DE using DIGE. Proteome extracted from control and perturbed systems are labeled differentially with the two fluorophores Cys 5 and Cys 3, respectively. The two labeled samples are then mixed and a single 2-DE is performed. The gel is then visualized using two different excitation wavelengths suitable for visualizing both fluorophores. The two images recorded at the different wavelengths are then compared with specific software capable of quantifying based on the intensities observed under the two different conditions employed for measurement. DeCyder Differential Analysis Software is capable of performing such comparison and has been developed by GE Healthcare Bio- Sciences Corp. (Piscataway, NJ).
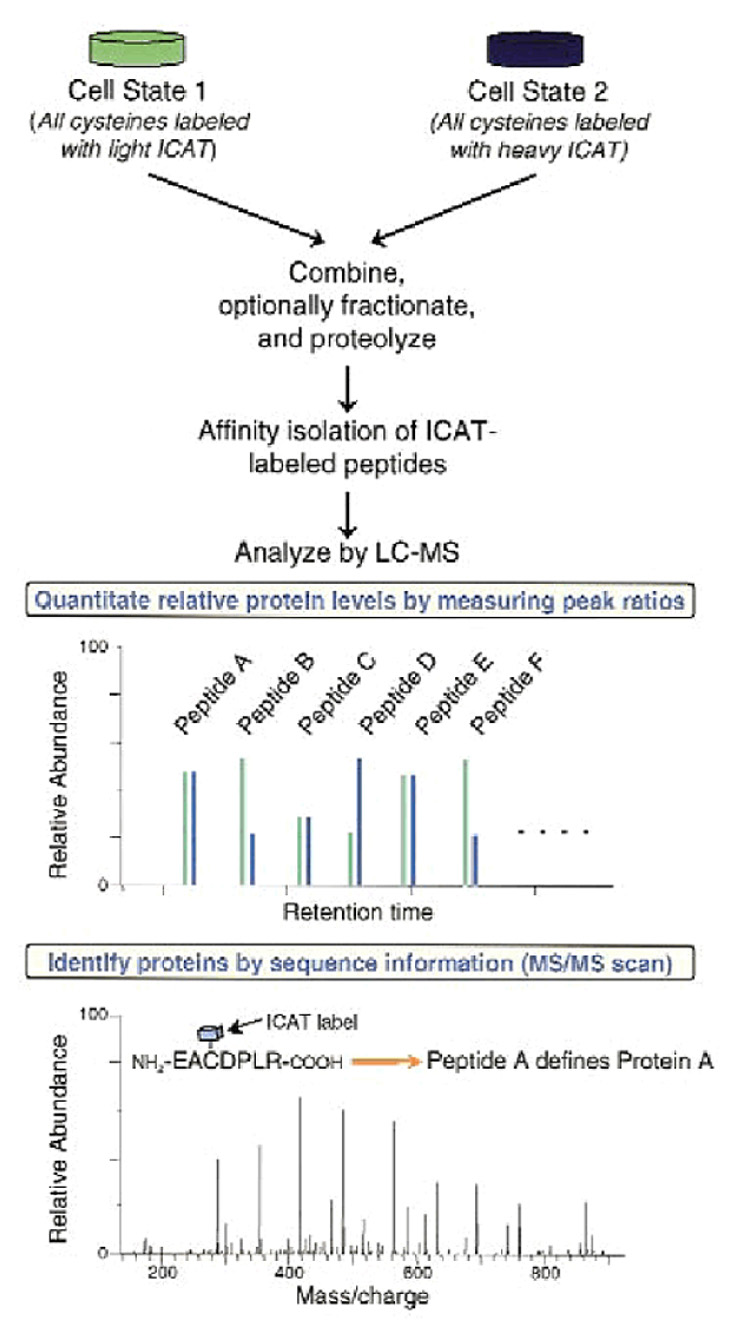
The ICAT strategy for quantifying differential protein expression. Two protein mixtures representing two different cell states have been treated with the isotopically light and heavy ICAT reagents, respectively; an ICAT reagent is covalently attached to each cysteinyl residue in every protein. Proteins from cell state 1 are shown in green, and proteins from cell state 2 are shown in blue. The protein mixtures are combined and proteolyzed to peptides, and ICAT-labeled peptides are isolated utilizing the biotin tag. These peptides are separated by microcapillary high-performance liquid chromatography. A pair of ICAT-labeled peptides are chemically identical and are easily visualized because they essentially coelute, and there is an 8 Da mass difference measured in a scanning mass spectrometer (four m/z units difference for a doubly charged ion). The ratios of the original amounts of proteins from the two cell states are strictly maintained in the peptide fragments. The relative quantification is determined by the ratio of the peptide pairs. Every other scan is devoted to fragmenting and then recording sequence information about an eluting peptide (tandem mass spectrum). The protein is identified by computer-searching the recorded sequence information against large protein databases. Reproduced from [65] with permission.
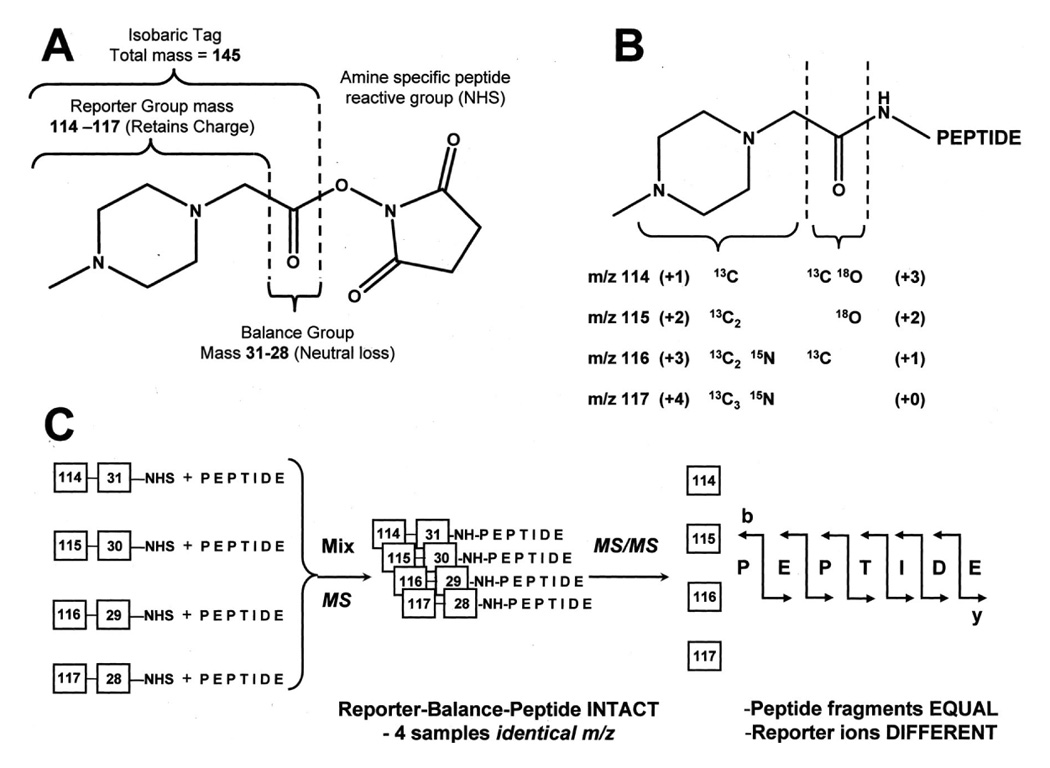
Diagram showing the components of the multiplexed isobaric tagging chemistry (A). The complete molecule consists of a reporter group (based on N-methylpiperazine), a mass balance group (carbonyl), and a peptide-reactive group (NHS ester). The overall mass of reporter and balance components of the molecule are kept constant using differential isotopic enrichment with 13C, 15N, and 18O atoms (B), thus avoiding problems with chromatographic separation seen with enrichment involving deuterium substitution. The number and position of enriched centers in the ring has no effect on chromatographic or MS behavior. The reporter group ranges in mass from m/z 114.1 to 117.1, while the balance group ranges in mass from 28 to 31 Da, such that the combined mass remains constant (145.1 Da) for each of the four reagents. B, when reacted with a peptide, the tag forms an amide linkage to any peptide amine (N-terminal or amino group of lysine). These amide linkages fragment in a similar fashion to backbone peptide bonds when subjected to CID. Following fragmentation of the tag amide bond, however, the balance (carbonyl) moiety is lost (neutral loss), while charge is retained by the reporter group fragment. The numbers in parentheses indicate the number of enriched centers in each section of the molecule. C, illustration of the isotopic tagging used to arrive at four isobaric combinations with four different reporter group masses. A mixture of four identical peptides each labeled with one member of the multiplex set appears as a single, unresolved precursor ion in MS (identical m/z). Following CID, the four reporter group ions appear as distinct masses (114–117 Da). All other sequence-informative fragment ions (b-, y-, etc.) remain isobaric, and their individual ion current signals (signal intensities) are additive. This remains the case even for those tryptic peptides that are labeled at both the N terminus and lysine side chains, and those peptides containing internal lysine residues due to incomplete cleavage with trypsin. The relative concentration of the peptides is thus deduced from the relative intensities of the corresponding reporter ions. In contrast to ICAT and similar mass-difference labeling strategies, quantitation is thus performed at the MS/MS stage rather than in MS. Reproduced from [70] with permission.
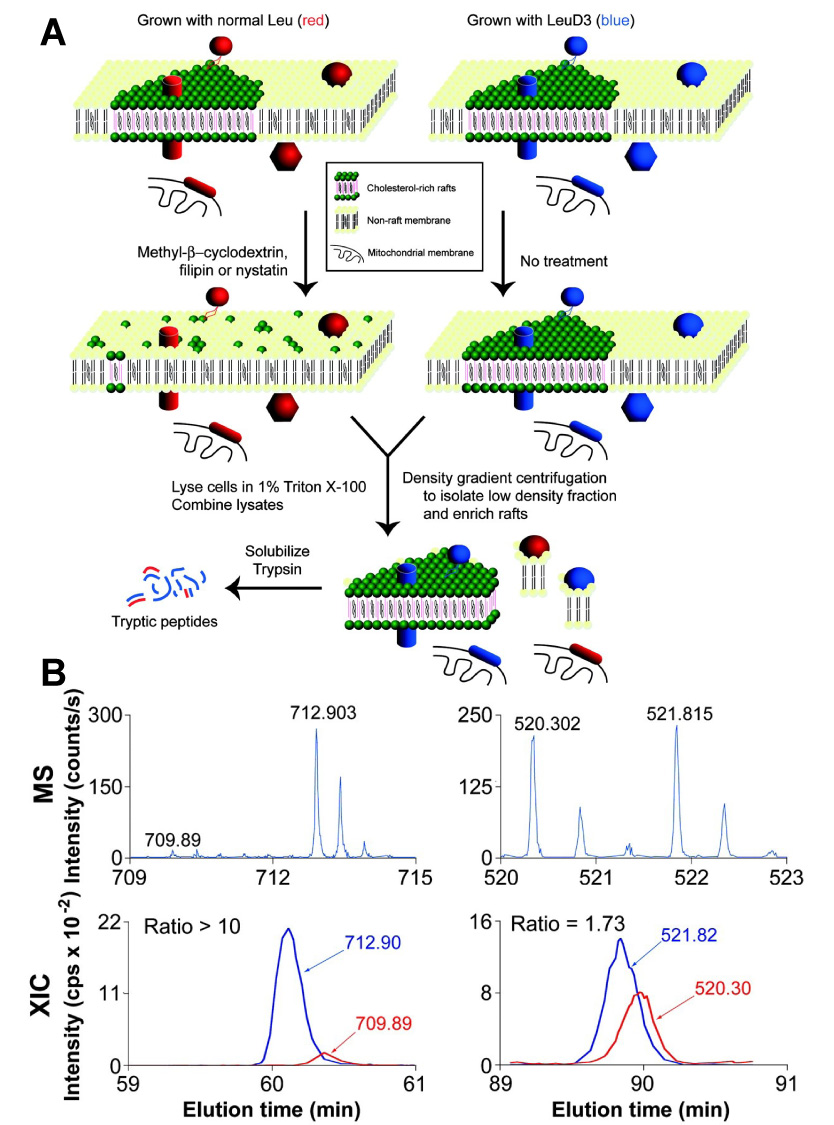
SILAC isolation scheme (A). Leu-labeled HeLa cells (depicted by red proteins/peptides) were treated with a cholesterol-disrupting agent, lysed, combined with lysates of LeuD3-labeled untreated HeLa cells (depicted by blue proteins/peptides), and used to prepare a detergent-resistant fraction. Because rafts in the drug-treated cells have lost their structural integrity, they no longer are purified in the detergent-resistant fraction, whereas nonraft contaminants originating from treated and untreated samples will copurify. Tryptic peptides were then prepared from isolated detergent- or pH/carbonate-resistant fractions MS and chromatograms (B). Representative MS and extracted ion chromatograms (XIC) for peptides from flotillin 1 and β-tubulin, two proteins identified in this study. Multiply charged peptides observed in MS mode were selected for fragmentation (MS/MS). Ion chromatograms (intensity vs. time) of Leu- and LeuD3-containing peptides identified by MS/MS were extracted from the series of MS scans and integrated by using SPINX (SILAC Peptide INtegration by XIC). Reproduced with modification from [83] with permission.
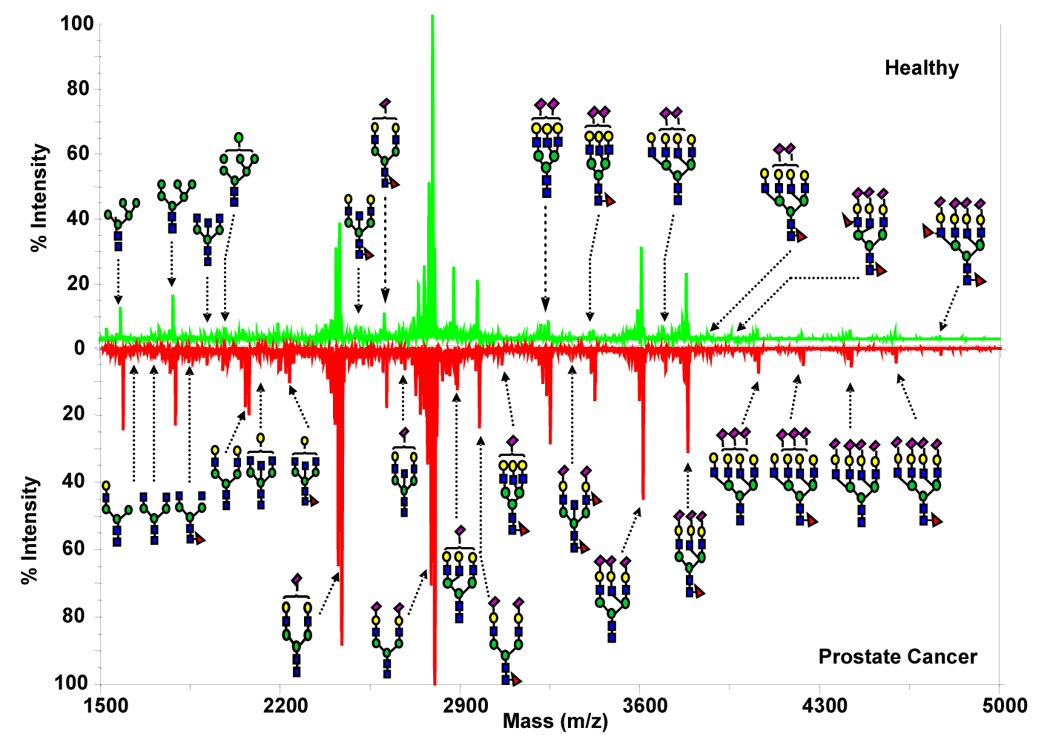
MALDI mirror spectra of permethylated N-glycans derived from human blood serum of a healthy individual vs. a prostate cancer patient. Symbols:  , N-acetylglucosamine;
  , mannose;
  , galactose;
  , fucose;
  , N-acetylneuraminic acid. Reproduced from [102] with permission.
, N-acetylglucosamine; , mannose; , galactose; , fucose; , N-acetylneuraminic acid. Reproduced from [102] with permission.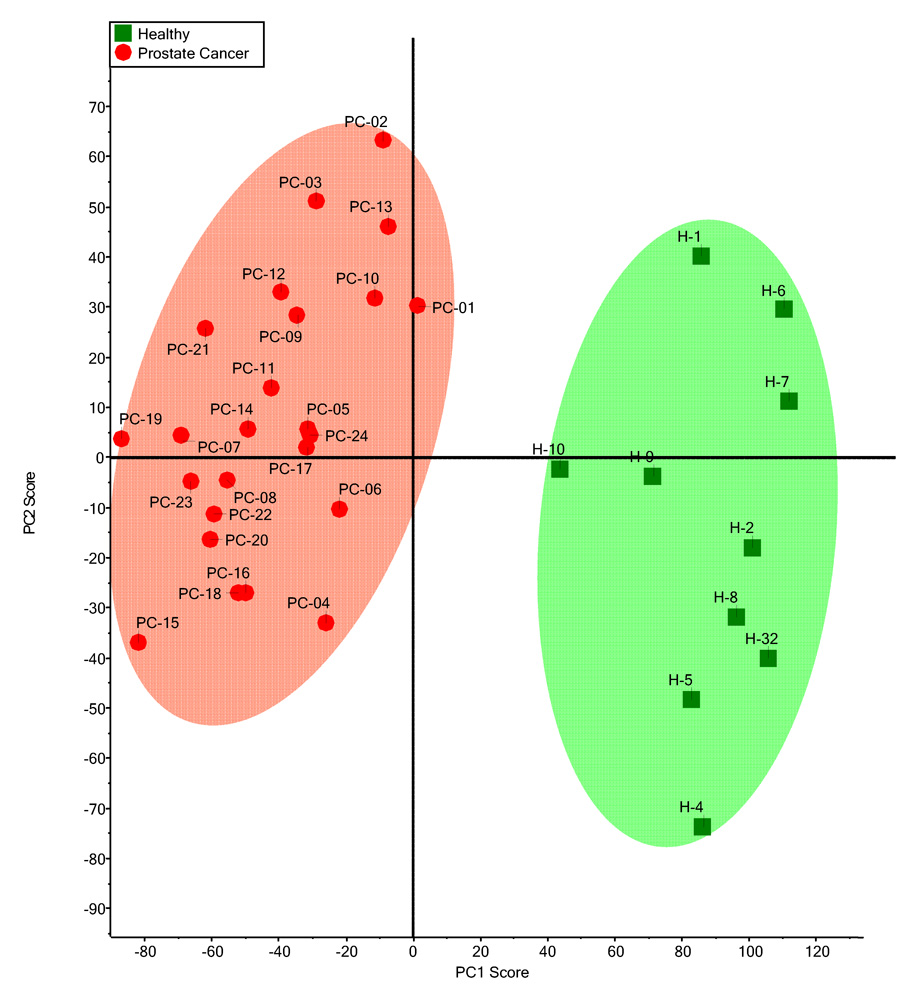
Principal component analysis (PCA) scores plot for mass spectra of glycans derived from blood sera of healthy individuals (n=10) and prostate cancer patients (n=24). Reproduced from [102] with permission.
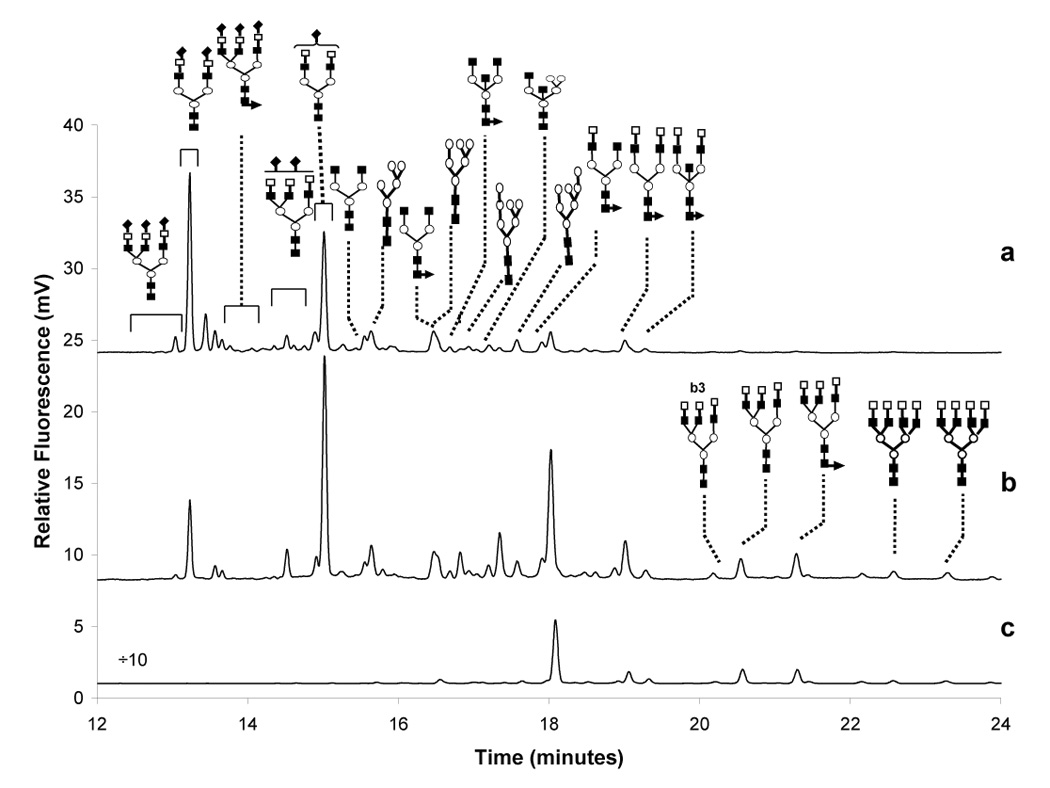
Electropherograms of N-glycans released from (a) human blood serum, (b) treated with 2–3 sialidase and (c) treated with 2–6 sialidase. Conditions: 60 cm acrylamide coated column (60 cm total length), 25 µm ID; LIF detection: argon-ion laser, excitation: 488 nm, emission: 520 nm; separation buffer: 40 mM Tris-HCl (pH 6.5), E=333 V/cm; 22.5° C. Symbols: □, galactose (Gal); ○, mannose (Man); ■, N-acetylglucosamine (GlcNAc); ▲, fucose (Fuc); and ♦, N-acetylneuraminic acid (NeuAC). Reproduced from [117] with permission.
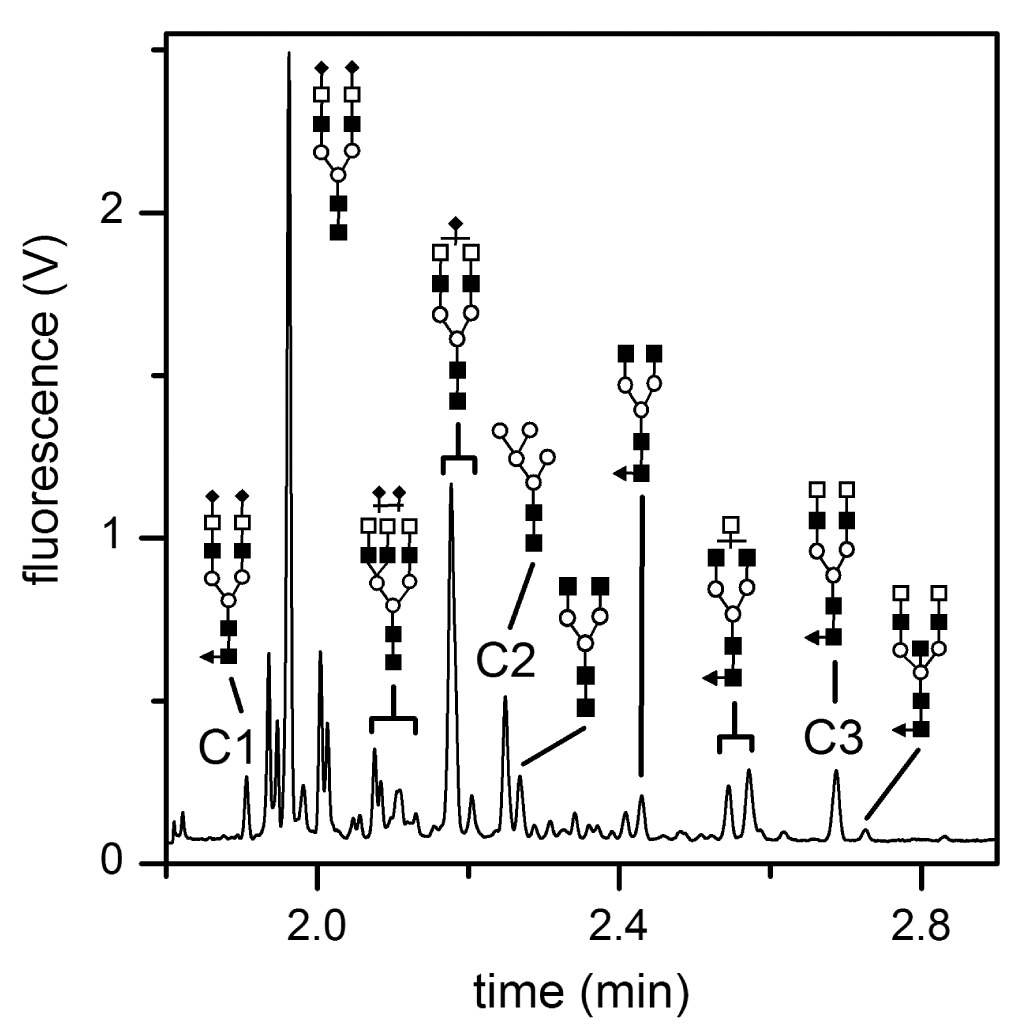
Electropherogram of N-glycans released from a blood serum sample from a stage IV breast cancer patient separated on the microfluidic device. The separation length was 22 cm, and the separation field strength was 750 V/cm. The separation efficiencies for components C1, C2, and C3 are listed in Table 2. Symbols: □ for galactose (Gal), ○ for mannose (Man), ■ for N-acetylglucosamine (GlcNAc), ▲ for fucose (Fuc), and ♦ for N-acetylneuraminic acid (NeuAC). Reproduced from [118] with permission.
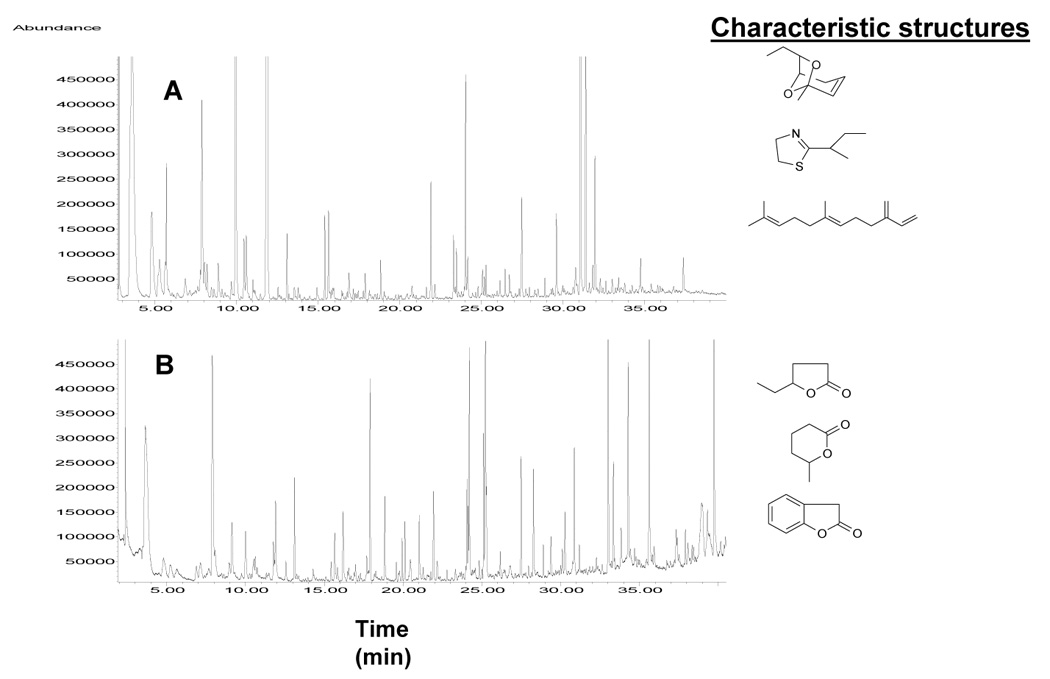
Comparative male mouse urinary volatile profiles for (A) Mus domesticus
and (B) Mus spicilegus by GC-MS with characteristic chemical structures.
Reproduced from [132] with permission.
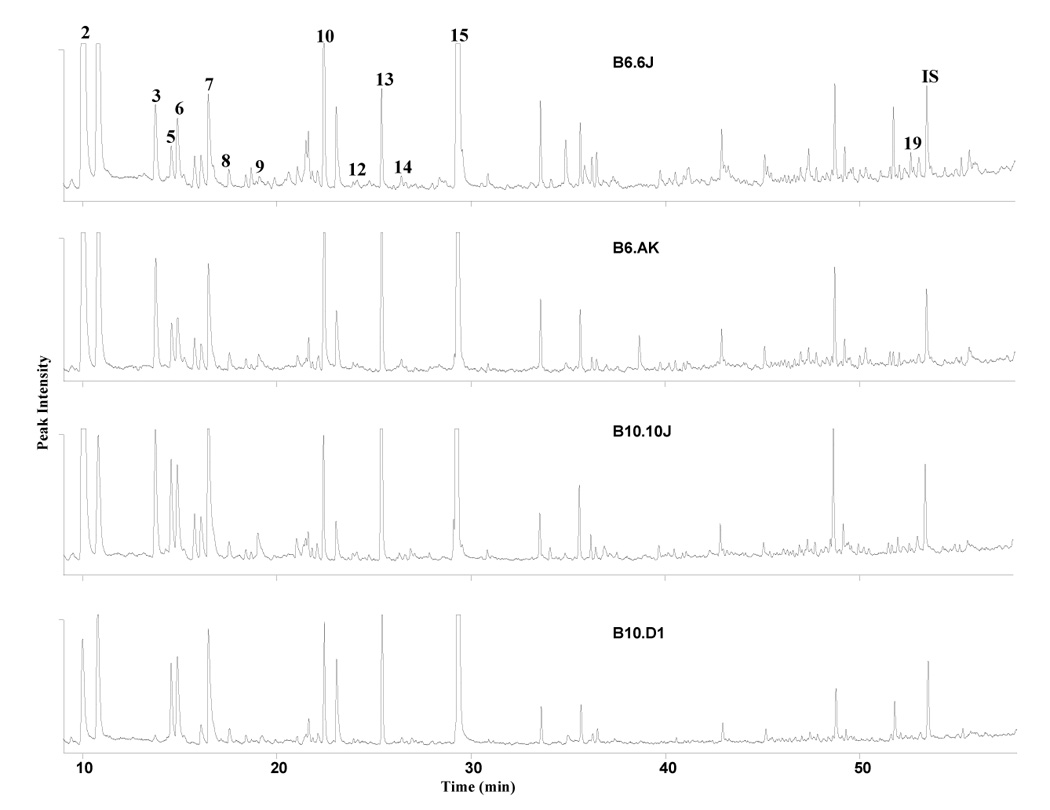
A comparison of male mouse urinary profiles measured by GC-AED carbon line 193 nm in different strains and haplotypes. Analysis conditions: capillary was HP-5MS (30 m × 0.25 mm, i.d., 0.25 µm film thickness) with the temperature program from 40° C (5 min) to 200° C at the rate of 2° C/min (10 min hold time). Numbers refer to compounds 2,3,7: dihydrofurans (DHF); 5: 2-heptanone; 6: 5-hepten-2-one; 8: 2-ethyl-5-methyl-5,6-dihydro-(4H)pyran; 9: 6-methyl-6-hepten-3-one; 10: 6-methyl-5-hepten-3-one; 12: limonene; 13: dehydro-exo-brevicomin (DHB); 14: acetophenone; 19: β-farnesene and IS: internal standard. Reproduced from [124] with permission.
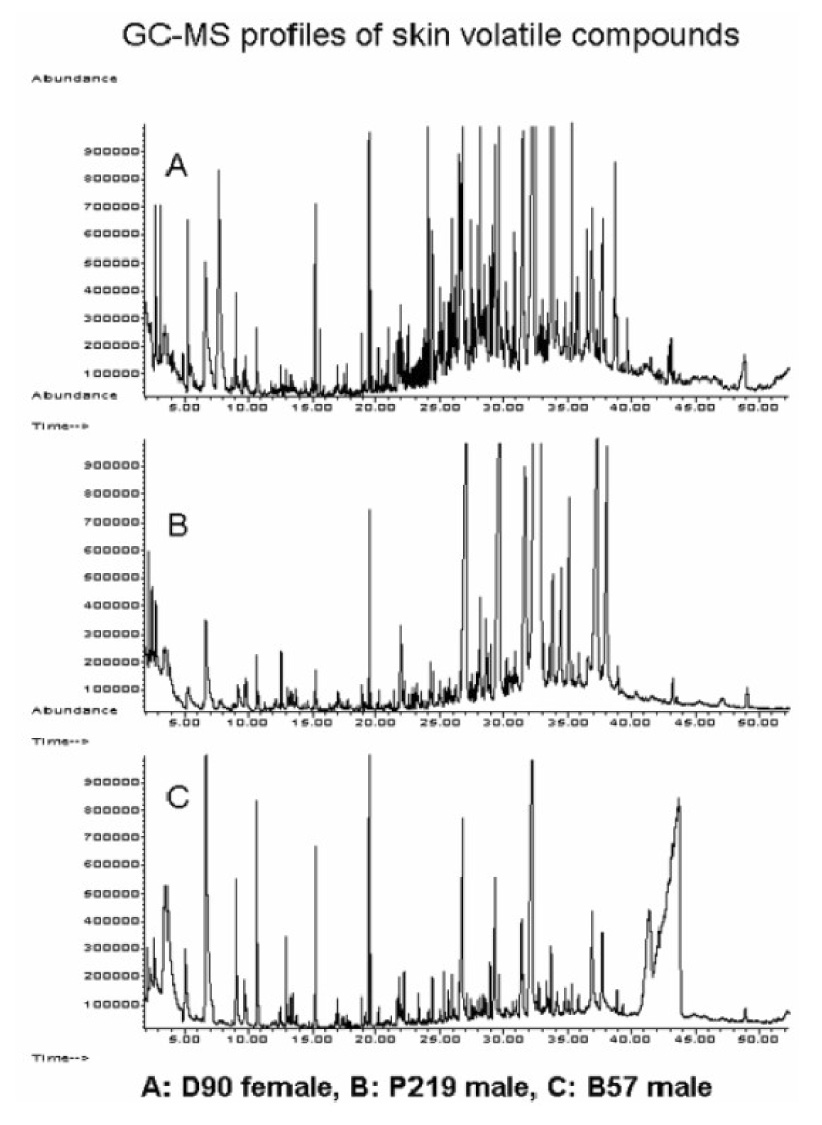
Representative human skin volatile profiles measured by GC-MS from different individuals within different families: A female (family D); B: male (family P); C: male (family B). Reproduced from supplementary data of [142] with permission.
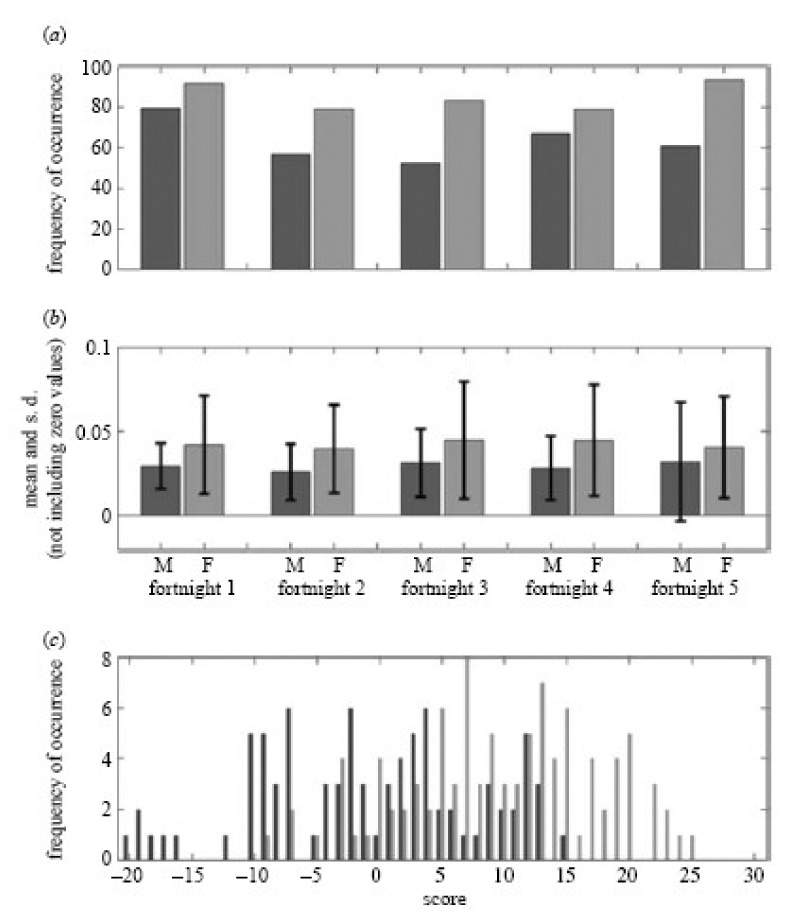
Distributions of markers that distinguish the sexes. (a) The distribution of the marker compound isopropyl hexadecanoate (RT 33.70 min), as the percentage of samples it was detected in and (b) mean and s.d. of the normalized squareroot intensity when detected in males and females, over all five fortnights. (c) Distribution of males and females is based on a model using the scoring system (black, male; grey, female). For each fortnight, if the male marker is detected in a specific individual, it is scored as K1, for a female marker it is scored as C1, so an individual scoring C35 contains the strongest possible female fingerprint, whereas an individual scoring K35 the strongest possible male fingerprint. Using a score of five as a divider between the classes, 75% can be correctly classified into their respective genders based on the presence and absence of 14 key markers. Reproduced from [142] with permission.
Similar articles
-
Inductively coupled plasma mass spectrometric detection for chromatography and capillary electrophoresis.J Chromatogr A. 1997 Nov 21;789(1-2):85-126. doi: 10.1016/s0021-9673(97)00970-9. J Chromatogr A. 1997. PMID: 9440286 Review.
-
Applications of mass spectrometry in metabolomic studies of animal model and invertebrate systems.Brief Funct Genomic Proteomic. 2009 Jan;8(1):28-48. doi: 10.1093/bfgp/eln052. Epub 2008 Dec 12. Brief Funct Genomic Proteomic. 2009. PMID: 19074496 Review.
-
Elemental speciation by chromatographic separation with inductively coupled plasma mass spectrometry detection.J Chromatogr A. 2002 Oct 18;974(1-2):1-21. doi: 10.1016/s0021-9673(02)01239-6. J Chromatogr A. 2002. PMID: 12458926 Review.
-
[Applications of chromatography in glycomics].Se Pu. 2024 Jul;42(7):646-657. doi: 10.3724/SP.J.1123.2023.12003. Se Pu. 2024. PMID: 38966973 Free PMC article. Review. Chinese.
-
Recent liquid chromatographic-(tandem) mass spectrometric applications in proteomics.J Chromatogr A. 2003 Jun 6;1000(1-2):589-608. doi: 10.1016/s0021-9673(03)00178-x. J Chromatogr A. 2003. PMID: 12877191 Review.
Cited by
-
Metabolomics and malaria biology.Mol Biochem Parasitol. 2011 Feb;175(2):104-11. doi: 10.1016/j.molbiopara.2010.09.008. Epub 2010 Oct 21. Mol Biochem Parasitol. 2011. PMID: 20970461 Free PMC article. Review.
-
Omics as a Tool to Help Determine the Effectiveness of Supplements.Nutrients. 2022 Dec 14;14(24):5305. doi: 10.3390/nu14245305. Nutrients. 2022. PMID: 36558464 Free PMC article. Review.
-
Analysis of glycans derived from glycoconjugates by capillary electrophoresis-mass spectrometry.Electrophoresis. 2011 Dec;32(24):3467-81. doi: 10.1002/elps.201100342. Electrophoresis. 2011. PMID: 22180203 Free PMC article. Review.
References
-
- Kitano H. Science. 2002;295:1662. - PubMed
-
- van Ommen B, Stierum R. Curr. Opin. Biotechnol. 2002;13:517. - PubMed
-
- Morel MN, Holland JM, van der Greef J, Maple EW, Clish C, Loscalzo J, Naylor S. Mayo Clin. Proc. 2004;79:651. - PubMed
-
- van der Greef J, Stroobant P, van der Heijden R. Curr. Opin. Chem. Biol. 2004;8:559. - PubMed
-
- Williams RJ. Biochemical Individuality. New York: Wiley and Sons; 1956.
Publication types
MeSH terms
Grants and funding
LinkOut - more resources
Full Text Sources
