. 2008 Jul;211(Pt 13):2172-84.
doi: 10.1242/jeb.016592.

Expression of myogenic regulatory factors in the muscle-derived electric organ of Sternopygus macrurus

Affiliations

Expression of myogenic regulatory factors in the muscle-derived electric organ of Sternopygus macrurus

Jung A Kim et al. J Exp Biol. 2008 Jul.

Abstract

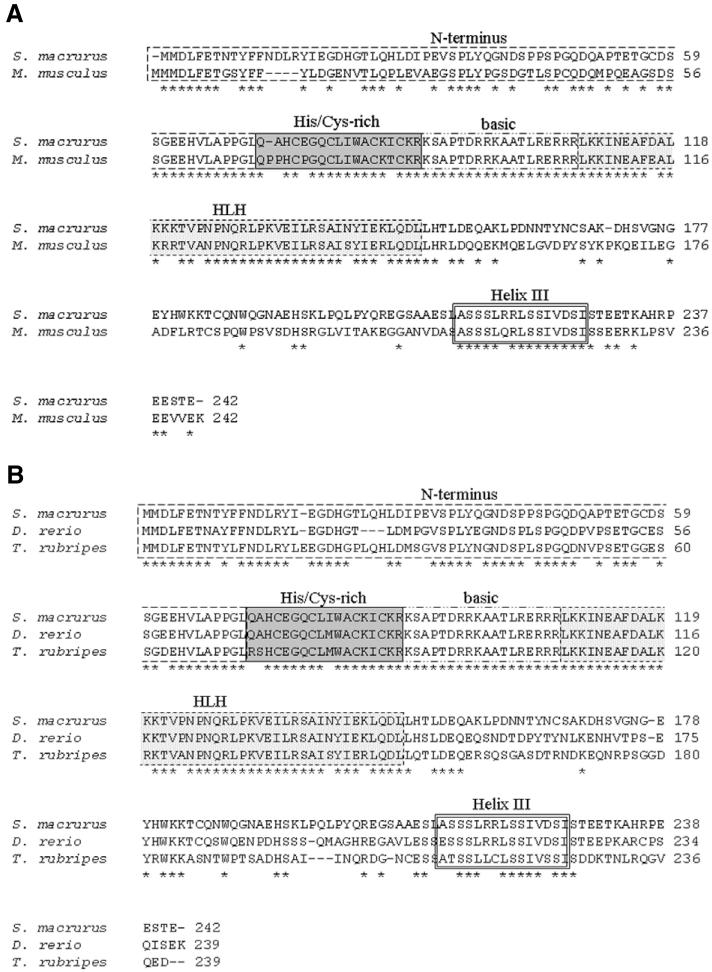
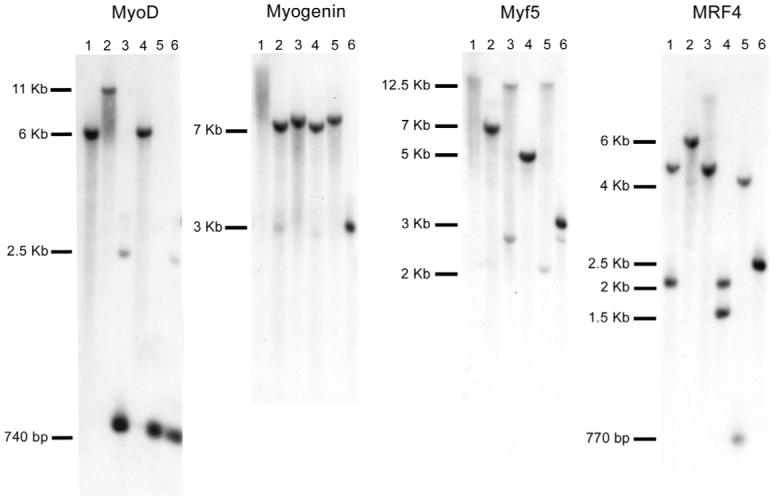
In most groups of electric fish, the current-producing cells of electric organs (EOs) derive from striated muscle fibers but retain some phenotypic characteristics of their precursor muscle cells. Given the role of the MyoD family of myogenic regulatory factors (MRFs) in the transcriptional activation of the muscle program in vertebrates, we examined their expression in the electrocytes of the gymnotiform Sternopygus macrurus. We estimated the number of MRF genes in the S. macrurus genome and our Southern blot analyses revealed a single MyoD, myogenin, myf5 and MRF4 gene. Quantitative RT-PCR showed that muscle and EO transcribe all MRF genes. With the exception of MyoD, the endogenous levels of myogenin, myf5 and MRF4 transcripts in electrocytes were greater than those detected in muscle fibers. These data indicate that MRF expression levels are not sufficient to predict the level to which the muscle program is manifested. Qualitative expression analysis of MRF co-regulators MEF2C, Id1 and Id2 also revealed these genes not to be unique to either muscle or EO, and detected similar expression patterns in the two tissues. Therefore, the partial muscle program of the EO is not associated with a partial expression of MRFs or with apparent distinct levels of some MRF co-factors. In addition, electrical inactivation by spinal cord transection (ST) resulted in the up-regulation of some muscle proteins in electrocytes without an accompanying increase in MRF transcript levels or notable changes in the co-factors MEF2C, Id1 and Id2. These findings suggest that the neural regulation of the skeletal muscle program via MRFs in S. macrurus might differ from that of their mammalian counterparts. Together, these data further our understanding of the molecular processes involved in the plasticity of the vertebrate skeletal muscle program that brings about the muscle-like phenotype of the non-contractile electrogenic cells in S. macrurus.


Figures

Fig. 1
Fig. 1
Sequence comparison of the deduced proteins encoded by S. macrurus myf5 with comparable sequences from mouse (A) and other piscine species (B). Protein sequences from mouse (M. musculus, GenBank accession number NP_032682.1), carp (C. carpio, GenBank accession number BAA33566), zebrafish (D. rerio, GenBank accession number NP_571651.1), striped seabass (M. saxitilis, GenBank accession number AF463525_1), rainbow trout (O. mykiss, GenBank accession number AAV30214) and pufferfish (T. rubripes, GenBank accession number CAC39208.1) were used. The boxed areas are labeled to indicate the N-terminal, His/Cys-rich, basic helix-loop-helix (bHLH) and helix III domains. Asterisks represent amino acid similarities across sequences.
Fig. 2
Fig. 2
Sequence comparison of the deduced protein encoded by S. macrurus MRF4 with comparable sequences from mouse (A) and other piscine species (B). Sequences from mouse (M. musculus, GenBank accession number 1604247A), zebrafish (D. rerio, GenBank accession number AAQ67704) and puffer fish (T. rubripes, GenBank accession number AAR20812) were used. The boxed areas are labeled to indicate the N-terminal, the His/Cys-rich, bHLH and Helix III domains. Asterisks represent amino acid similarities across sequences.
Fig. 3
Fig. 3
Expression of MyoD, myogenin, myf5 and MRF4 transcripts in adult tissues of S. macrurus by RT-PCR analysis. Total RNAs from skeletal muscle, EO, liver and brain were reverse transcribed and used for PCR. PCR products (1.0 μg per lane) were resolved on agarose gels containing ethidium bromide, and the resultant bands are presented as negative images of the original gels. Partial cDNA fragments of MyoD (290 bp), myogenin (312 bp), myf5 (209 bp) and MRF4 (301 bp) were detected in skeletal muscle and EO, but not in liver or brain. Control reactions without reverse transcriptase (No RT lanes) were carried out for muscle (lane 2), EO (lane 4), liver (lane 6) and brain (lane 8) to ensure that PCR products were RNA dependent and not the result of genomic DNA amplification. RT-PCR analysis of glyceraldehyde dehydrogenase (GAPDH) was used as a loading control. Lanes labelled M represent the 1 kb+ DNA ladder.
Fig. 4
Fig. 4
Expression of MyoD, myogenin, myf5 and MRF4 transcripts in muscle and EO from control fish (N=5) and fish after 5 weeks spinal transection (ST, N=5) by quantitative RT-PCR. The amount of MyoD, myogenin, myf5 and MRF4 transcript per tissue type was obtained from real-time RT-PCR experiments, and data are represented as molecules of transcript per μl of mRNA of each tissue type. Each column represents the mean ± s.e.m. Significantly different from control; *significantly different from control or 5 week ST muscle groups at P≤0.05.
Fig. 5
Fig. 5
Expression of Id1, Id2 and MEF2C in adult tissues of S. macrurus by RT-PCR. Agarose gel showing the expression of partial Id1 (304 bp), Id2 (101 bp) and MEF2C (265 bp) cDNA fragments in skeletal muscle, EO, liver, brain and heart of S. macrurus using RT-PCR. For each transcript, 1 μg of cDNA was used for the PCR amplification. RT-PCR analysis of GAPDH was used as a loading control. Lanes labeled M represent the 1kb+ or 25 bp (Id2) DNA ladder. Other lanes as in Fig. 3.
Fig. 6
Fig. 6
Expression of Id1, Id2 and MEF2C in adult and 5 week ST muscle and EO by RT-PCR. Agarose gel showing the expression of Id1, Id2 and MEF2C in skeletal muscle and EO from control un-operated and 5 week ST fish using RT-PCR. Id1, Id2 and MEF2C transcripts were detected in all tissues analyzed. The size of the cDNA fragments for each transcript was the same as that in Fig. 5; 1 μg of cDNA was used for PCR amplification. RT-PCR analysis of GAPDH was used as a loading control. Lanes labeled M represent the 1 kb+ or 25 bp (Id2) DNA ladder. Other lanes as in Fig. 3.
Fig. 7
Fig. 7
Genomic Southern blot analysis of the MyoD, myogenin, myf5 and MRF4 genes. Genomic DNA prepared from S. macrurus adults was digested with BamHI (lane 1), EcoRI (lane 2), HindIII (lane 3), BamHI/EcoRI (lane 4), BamHI/HindIII (lane 5) and EcoRI/HindIII (lane 6), resolved by 1% agarose gel electrophoresis, and transferred to a nylon membrane. Genomic DNA was loaded at 5 μg per lane. Blots were hybridized with 32P-labeled probes specific to S. macrurus MyoD, myogenin, myf5 and MRF4, and washed under high stringency conditions.

Similar articles

Cited by

References

    1. Benezra R, Davis RL, Lockshon D, Turner DL, Weintraub H. The protein Id: a negative regulator of helix-loop-helix DNA binding proteins. Cell. 1990;61:49–59. - PubMed
    1. Bergstrom DA, Tapscott SJ. Molecular distinction between specification and differentiation in the myogenic basic helix-loop-helix transcription factor family. Mol. Cell. Biol. 2001;21:2404–2412. - PMC - PubMed
    1. Braun T, Winter B, Bober E, Arnold HH. Transcriptional activation domain of the muscle-specific gene regulatory protein myf5. Nature. 1990;346:663–665. - PubMed
    1. Buckingham ME. Muscle: the regulation of myogenesis. Curr. Opin. Genet. Dev. 1994;4:745–751. - PubMed
    1. Buller AJ, Eccles JC, Eccles RM. Interactions between motoneurones and muscles in respect of the characteristic speeds of their responses. J. Physiol. 1960;150:417–439. - PMC - PubMed

Publication types

MeSH terms

Associated data