Comparative Study
. 2008 Oct;49(10):4679-87.
doi: 10.1167/iovs.08-2135. Epub 2008 Jun 14.

Individual variations in human cone photoreceptor packing density: variations with refractive error

Affiliations
Comparative Study

Individual variations in human cone photoreceptor packing density: variations with refractive error

Toco Yuen Ping Chui et al. Invest Ophthalmol Vis Sci. 2008 Oct.

Erratum in

  • Invest Ophthalmol Vis Sci. 2009 Jan;50(1):46

Abstract

Purpose: To measure the variation in human cone photoreceptor packing density across the retina, both within an individual and between individuals with different refractive errors.

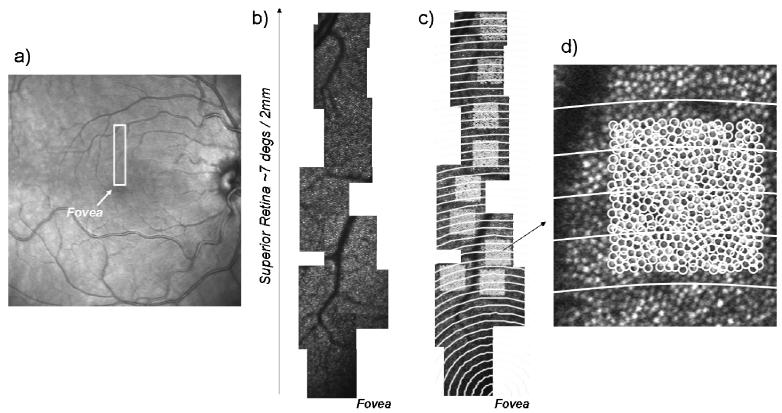
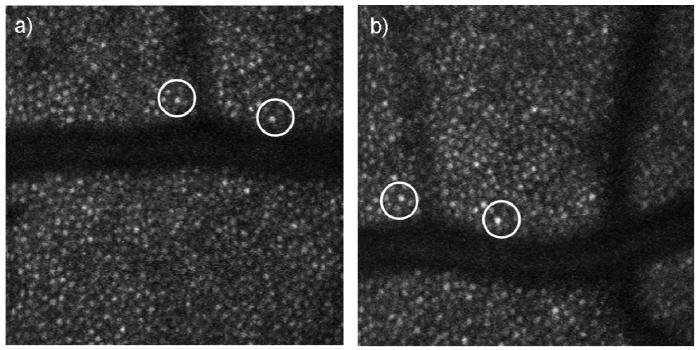
Methods: A high-resolution adaptive optics scanning laser ophthalmoscope was used to image the cones of 11 human eyes. Five subjects with emmetropia and six subjects with myopia were tested (+0.50 to -7.50 D). For each subject, four approximately 10 degrees x 1.5 degrees strips of cone images were obtained. Each strip started at the fovea and proceeded toward the periphery along the four primary meridians. The position of each cone within the sampling windows was digitized manually by the investigator. From these cone counts, the density of the cones was calculated for a set of fixed distances from the fovea at locations throughout the image.

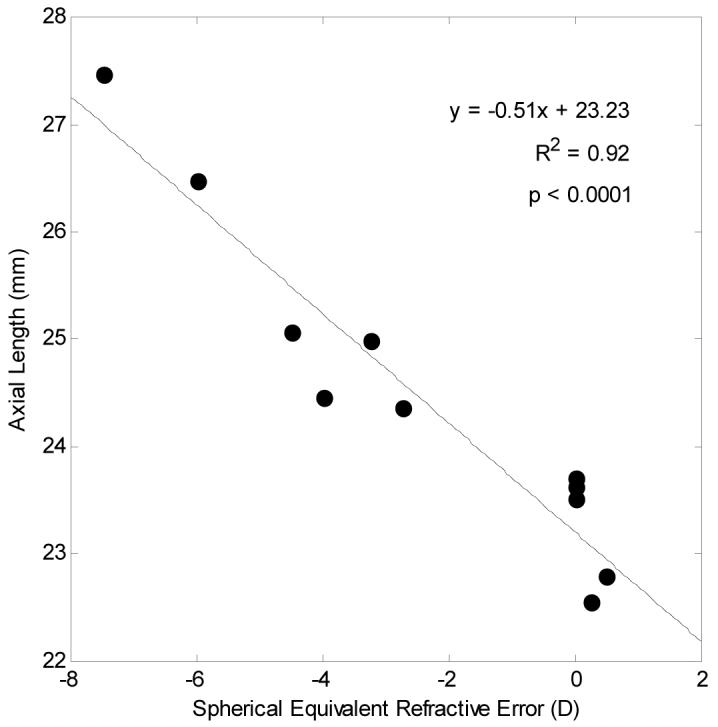
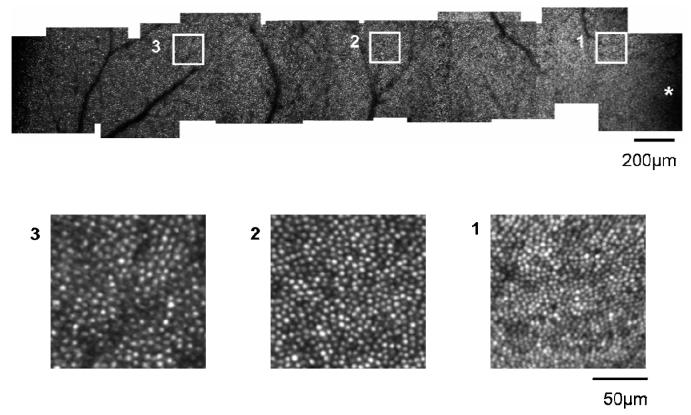
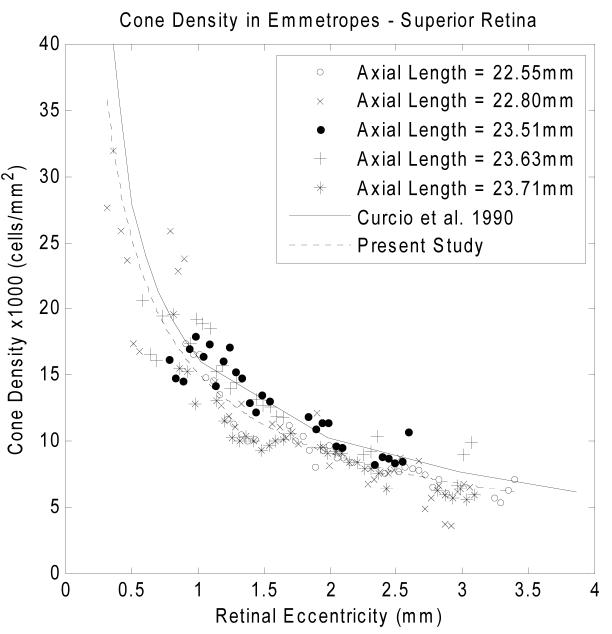
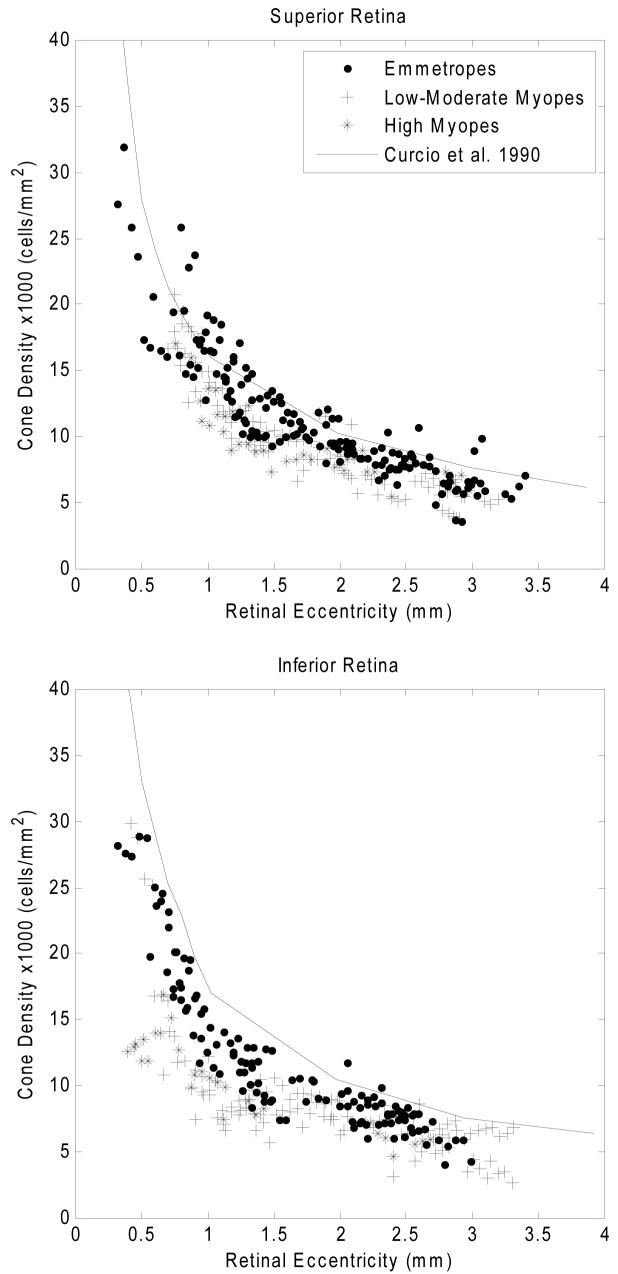
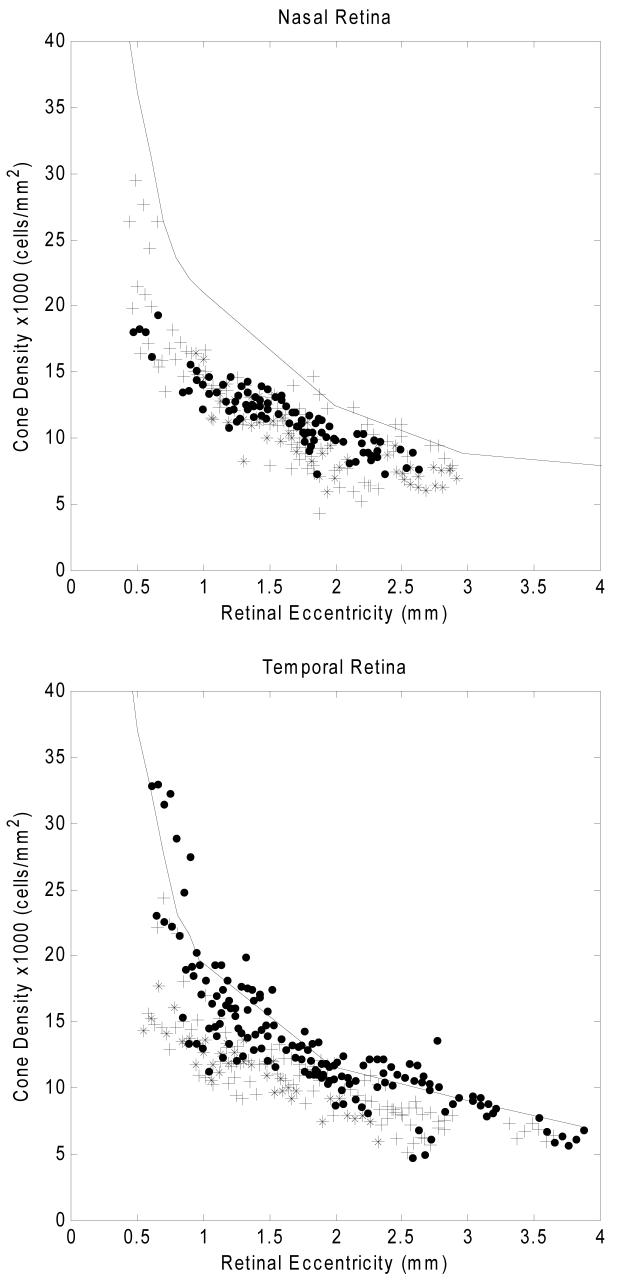
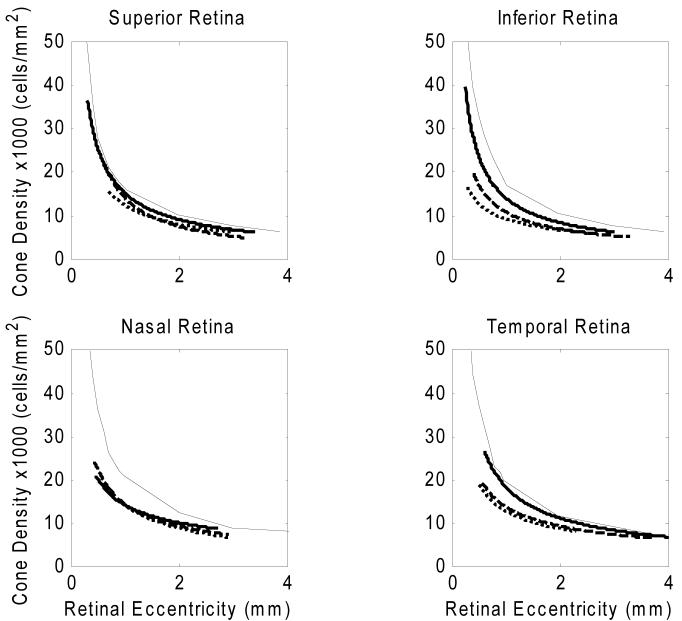
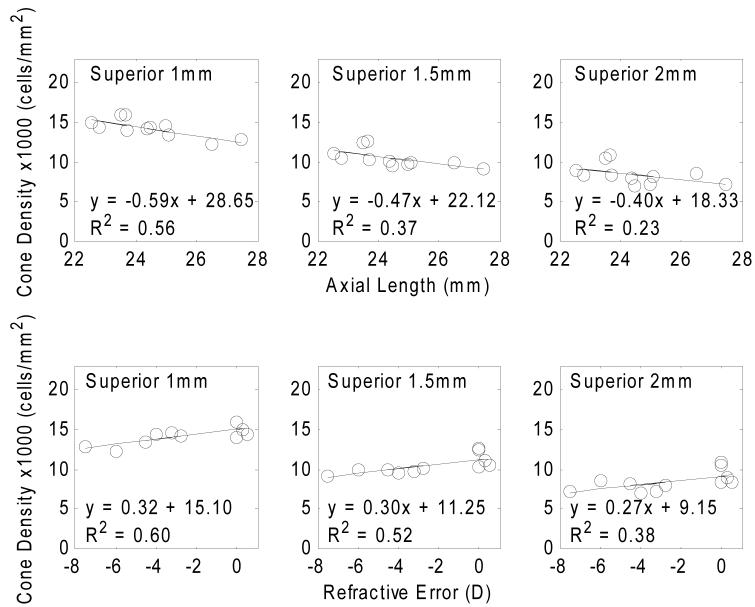
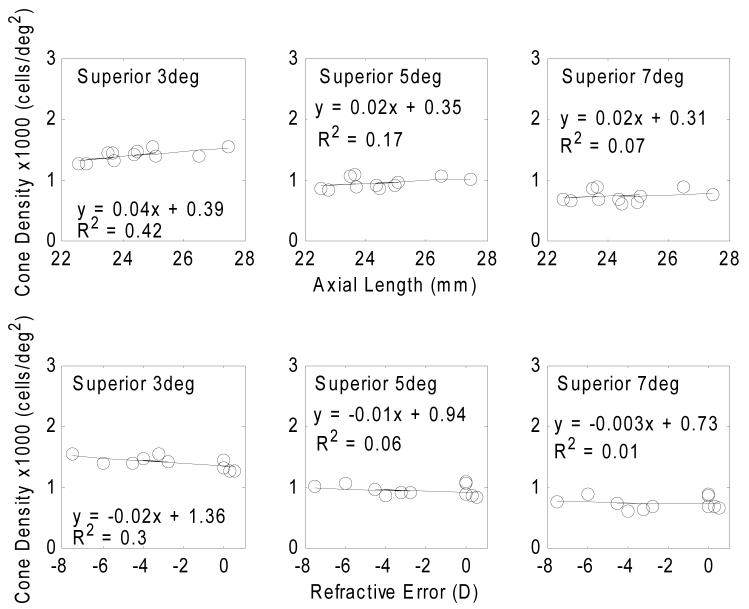
Results: Cone photoreceptor packing density decreased from 27,712 cells/mm(2) to 7,070 cells/mm(2) from a retinal eccentricity of 0.30 to 3.40 mm along the superior meridian in five emmetropic eyes. Cone photoreceptor packing density (cells per square millimeter) was significantly lower in myopic eyes than in emmetropic eyes. At a given location, there was considerable individual variation in cone photoreceptor packing density, although more than 20% of the variance could be accounted for by differences in axial length.

Conclusions: The results provide a baseline analysis of individual difference in cone photoreceptor packing density in healthy human eyes. As predicted by retinal stretching models, cone photoreceptor packing density is lower in highly myopic eyes than in emmetropic eyes.


Figures

Fig. 1
Fig. 1
a) HRA fundus image of subject 01. The box indicates the region for high resolution imaging in the superior field. b). Montage of a series of high resolution images reaching from the fovea (lower right) to the superior periphery. c) Same region of retina, indicating regions for cone counting, with constant distances from the fovea indicated by concentric white circles. d) One of the regions of interest expanded to show individual cones as well as the distance bins.
Fig. 2
Fig. 2
AOSLO images of a -4.50D myope. Single frame AOSLO images a) with spectacle lens correction. b) With contact lens correction. Pixel distance is determined by the distance between two distinctive cones (circles). When corrected using our optical model, the results were within 2% of each other, despite the relatively large magnification change due to the use of trial lenses in one of the conditions.
Fig. 3
Fig. 3
Relationship between axial length (mm) and spherical equivalent refractive error (D) in subjects’ right eyes. Linear regression to the data is showed by the solid line.
Fig. 4
Fig. 4
Upper panel: Temporal montage from subject 10, an emmetrope with an axial length of 23.71mm. This montage spans approximately 10 degrees from the fovea (* lower right corner) to the temporal retina (left side of image). The scale bar represents 200μm. Lower Panels: Averaged subregions matching the square region indicated in the upper panel. Cone photoreceptors have been resolved at retinal locations from approximately 1 degree to 10 degrees. Scale bar represents 50μm.
Fig. 5
Fig. 5
Variation of cone packing density with retinal eccentricity along the superior meridian for five emmetropic subjects. Cone packing density decreases from 27,712 cells/mm2 to 7,070 cells/mm2 from the retinal eccentricity of 0.30mm to 3.40mm along the superior meridian. The solid curve indicates the result from the study of Curcio and colleagues . The dashed curve indicates a power law fit for the five emmetropes in Group 1.
Fig. 6
Fig. 6
Comparison of cone packing density for 3 groups of subjects differing in refractive error at four meridians. Upper right panels: the data are for measurements along the superior meridian. Filled symbols are data from five emmetropes, plus symbols are data from four low-to-moderate myopes, and asterix symbols are from two high myopes. Anatomical values are based on published cone packing density in human retina from Curcio and colleagues (Solid curve). Other panels: Comparison of cone packing density for 3 groups of subjects for the inferior, nasal, and temporal meridians.
Fig. 6
Fig. 6
Comparison of cone packing density for 3 groups of subjects differing in refractive error at four meridians. Upper right panels: the data are for measurements along the superior meridian. Filled symbols are data from five emmetropes, plus symbols are data from four low-to-moderate myopes, and asterix symbols are from two high myopes. Anatomical values are based on published cone packing density in human retina from Curcio and colleagues (Solid curve). Other panels: Comparison of cone packing density for 3 groups of subjects for the inferior, nasal, and temporal meridians.
Fig. 7
Fig. 7
Comparisons of cone packing densities obtained from the study of Curico and colleagues (solid curves) and data from the emmetropes in the present study (heavy solid curves), low-to-moderate myopes (dashed curves), and high myopes (dotted curves) in each of the four meridians. The data from the present study were fit using power law fitting, and the lines are based on this fitting.
Fig. 8
Fig. 8
Variation of cone packing density (cells/mm2) with axial length (upper row) and refractive error (lower row) at 3 retinal eccentricities on superior meridian. Circle symbols indicate the estimation of cone packing density from individual eyes. Linear regressions to the data are showed by the solid lines. All regression slopes are statistically significant with p<0.05.
Fig. 9
Fig. 9
Variation of cone packing density (cells/deg2) with axial length (upper row) and refractive error (lower row) at 3 retinal eccentricities along the superior meridian. Circle symbols indicate the estimation of cone packing density from individual eyes. The results of a linear regressions to the data are displayed as the solid lines and the equation. All regression slopes are statistically non-significant with p> 0.05.
Fig. 10
Fig. 10
Relationship between retinal resolution acuity and spherical equivalent refractive error. The y axis in the graph indicates the retinal resolution acuity in cyc/mm. Filled and open circles indicate the computed temporal retinal resolution acuity at 4 degree and 10 degree retinal eccentricities respectively. The dashed lines are the linear fits to these data at 4 degrees (y1: heavy dashed line) and 10 degrees (y3: light dashed line). The solid lines are the linear regression of retinal resolution acuity at 4 degrees (y2: heavy solid line) and 10 degrees (y4: light solid line) from the study of Coletta & Watson .

References

    1. Liang J, Williams DR, Miller DT. Supernormal vision and high-resolution retinal imaging through adaptive optics. J Opt Soc Am A Opt Image Sci Vis. 1997;(14):2884–2892. - PubMed
    1. Roorda A, Romero-Borja F, Donnelly WJ, Queener H, Hebert TJ, Campbell MCW. Adaptive optics scanning laser ophthalmoscopy. Optics Express. 2002;(10):405–412. - PubMed
    1. Roorda A. Adaptive optics ophthalmoscopy. J Refract Surg. 2000;(16):S602–607. - PubMed
    1. Pircher M, Zawadzki RJ, Evans JW, Werner JS, Hitzenberger CK. Simultaneous imaging of human cone mosaic with adaptive optics enhanced scanning laser ophthalmoscopy and high-speed transversal scanning optical coherence tomography. Opt Lett. 2008;(33):22–24. - PMC - PubMed
    1. Duncan JL, Zhang Y, Gandhi J, et al. High-resolution imaging with adaptive optics in patients with inherited retinal degeneration. Invest Ophthalmol Vis Sci. 2007;(48):3283–3291. - PubMed

Publication types