. 2008 Jul;40(7):897-903.
doi: 10.1038/ng.154. Epub 2008 Jun 15.

Combinatorial patterns of histone acetylations and methylations in the human genome

Affiliations

Combinatorial patterns of histone acetylations and methylations in the human genome

Zhibin Wang et al. Nat Genet. 2008 Jul.

Abstract

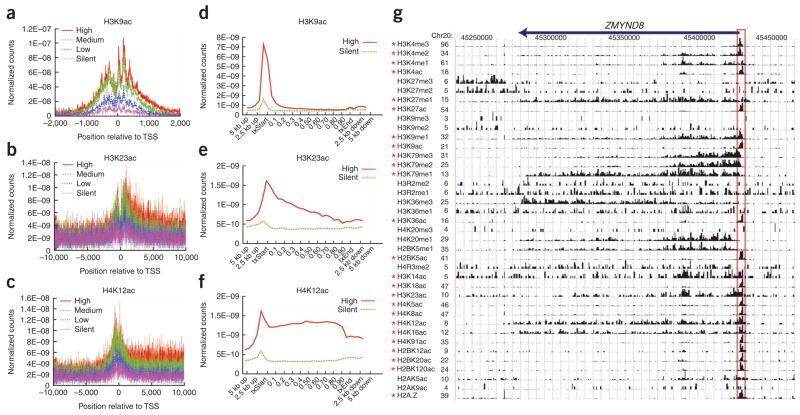
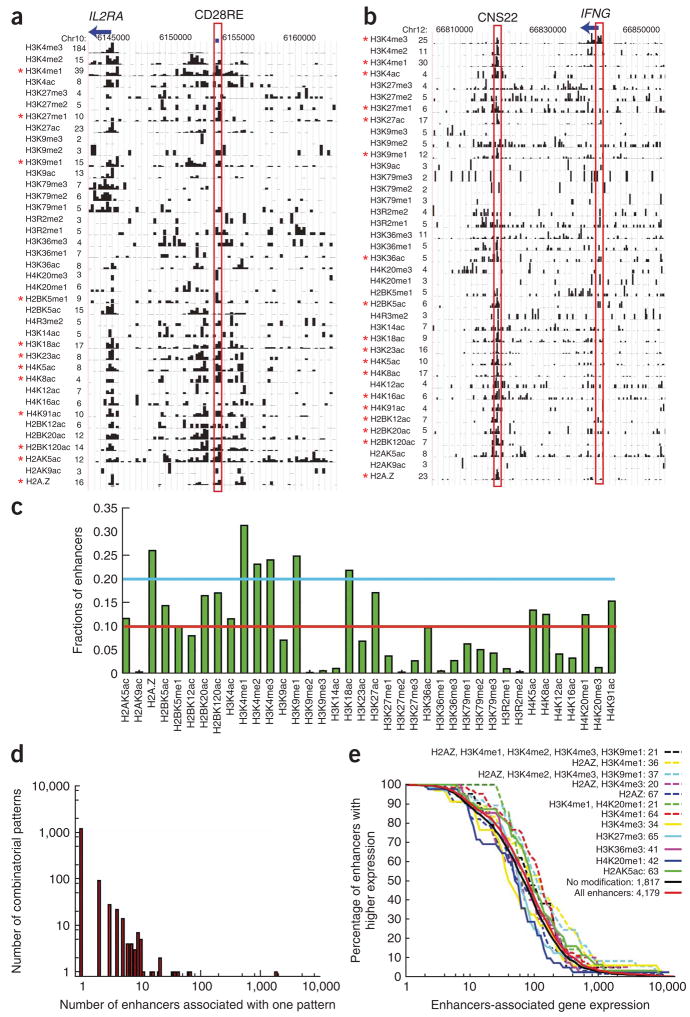
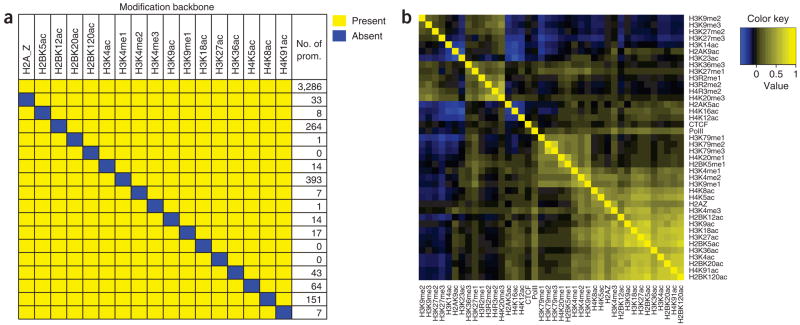
Histones are characterized by numerous posttranslational modifications that influence gene transcription. However, because of the lack of global distribution data in higher eukaryotic systems, the extent to which gene-specific combinatorial patterns of histone modifications exist remains to be determined. Here, we report the patterns derived from the analysis of 39 histone modifications in human CD4(+) T cells. Our data indicate that a large number of patterns are associated with promoters and enhancers. In particular, we identify a common modification module consisting of 17 modifications detected at 3,286 promoters. These modifications tend to colocalize in the genome and correlate with each other at an individual nucleosome level. Genes associated with this module tend to have higher expression, and addition of more modifications to this module is associated with further increased expression. Our data suggest that these histone modifications may act cooperatively to prepare chromatin for transcriptional activation.


Figures

Figure 1
Figure 1
Three distribution patterns of histone acetylations. (ac) Normalized tag counts of histone acetylation signals surrounding the TSS were indicated for highly active, intermediately active (two levels) and silent genes. Each group represents 1,000 genes with similar expression, as described in Methods. (df) Normalized tag counts of histone acetylation signals of 1,000 highly active or silent genes across the gene bodies. The plots extend 5 kb 5′ and 3′ of the genic regions (see Methods). txStart, transcription start site; txEnd, transcription end. (g) Chromatin modification patterns at the ZMYND8 (PRKCBP1) gene locus. Significant modifications in the −1 kb to +1 kb region surrounding the TSS (P <10−7; highlighted in red) are indicated by asterisks on the left.
Figure 2
Figure 2
Patterns of histone modifications associated with promoters. (a) Patterns of histone modifications at promoters. The y axis indicates the number of patterns of 39 histone modifications (see Methods), and the x axis indicates the number of promoters associated with each pattern. (b) Correlation of gene expression with the thirteen most prevalent modification patterns. B, the 17-modification backbone; All, all genes. The number of promoters within each pattern is also indicated. The gene expression is determined using DNA microarrays. See Figure 4a for the composition of ‘backbone’. (c) Correlation of each modification with gene expression. The changes in gene expression (log2) are calculated by comparing the average expression of the subsets of genes with or without a particular modification.
Figure 3
Figure 3
Patterns of histone modifications at enhancers. (a) The histone modification pattern at the CD28RE enhancer (highlighted in red) of the IL2RA gene. Significant modifications are indicated by asterisks on the left. (b) Histone modification patterns at the IFNG gene and its downstream enhancer, CNS22, are shown. Significant modifications at CNS22 are indicated by asterisks on the left. (c) The fractions of enhancers associated with each of the 38 modifications. (d) Patterns of histone modifications at 4,179 DNase hypersensitive sites. The y axis indicates the number of patterns, and x axis indicates the number of hypersensitive sites associated with each pattern. (e) Correlation analysis of gene expression with the ten largest modification patterns by assigning an enhancer to the TSS of the nearest known gene. All, all DNase I hypersensitive sites. The number of hypersensitive sites associated with each pattern is indicated.
Figure 4
Figure 4
Correlation of histone modifications in the genome. (a) A group of 17 modifications, the ‘backbone’ in Figure 2b, tend to coexist. The numbers of promoters associated with all the 17 modifications or missing any one modification (the blue rectangle) are indicated on the right. (b) Tags are binned into nonoverlapping 200-bp bins along the genome. Using the tallies for each bin, we calculated a pairwise Spearman correlation coefficient for each pair of modifications to create a correlation coefficient matrix. A heat map was then generated from this matrix.
Figure 5
Figure 5
Characteristic spatial distribution of mutually exclusive modifications. (a) The distribution of H2BK5me1 (upper) and H2BK5ac (lower) surrounding the ZNF101 gene. (b) The composite profiles of H2BK5me1 (green) and H2BK5ac (red) surround the TSS regions of 1,000 active genes. (c) The distribution patterns of H3K36me3 (upper), H3K36me1 (middle) and H3K36ac (lower) surrounding the ZNF101 gene. (d) The composite profiles of H3K36ac (red) are compared with the two states of H3K36 methylation (H3K36me1 and H3K36me3) surrounding the TSS regions of 1,000 active genes. (e) The distribution patterns of H3K4ac and the three states of H3K4 methylation surrounding the promoter region of the SMAP gene. (f) The composite profiles of H3K4ac (red) are compared with the three states of H3K4 methylation (H3K4me1, H3K4me2 and H3K4me3) surrounding the TSS regions of 1,000 active genes. (g) The distribution patterns of H3K27ac and the three states of H3K27 methylation surrounding the SMAP gene. (h) The composite profiles of H3K27ac (red) are compared with the three states of H3K27 methylation (H3K27me1, H3K27me2 and H3K27me3) surrounding the TSS regions of 1,000 active genes. (i) The distribution patterns of H3K9ac and the three states of H3K9 methylation surrounding the SMAP gene. (j) The composite files of H3K9ac (red) are compared with the three states of H3K9 methylation (H3K9me1, H3K9me2 and H3K9me3) surrounding the TSS regions of 1,000 active genes.

References

    1. Kouzarides T. Chromatin modifications and their function. Cell. 2007;128:693–705. - PubMed
    1. Felsenfeld G, Groudine M. Controlling the double helix. Nature. 2003;421:448–453. - PubMed
    1. Bernstein BE, Meissner A, Lander ES. The mammalian epigenome. Cell. 2007;128:669–681. - PubMed
    1. Zhang Y, Reinberg D. Transcription regulation by histone methylation: interplay between different covalent modifications of the core histone tails. Genes Dev. 2001;15:2343–2360. - PubMed
    1. Shahbazian MD, Grunstein M. Functions of site-specific histone acetylation and deacetylation. Annu Rev Biochem. 2007;76:75–100. - PubMed

Publication types