. 2008 Aug;14(8):863-8.
doi: 10.1038/nm1783. Epub 2008 Jun 15.

A tumor necrosis factor-alpha-mediated pathway promoting autosomal dominant polycystic kidney disease

Affiliations

A tumor necrosis factor-alpha-mediated pathway promoting autosomal dominant polycystic kidney disease

Xiaogang Li et al. Nat Med. 2008 Aug.

Abstract

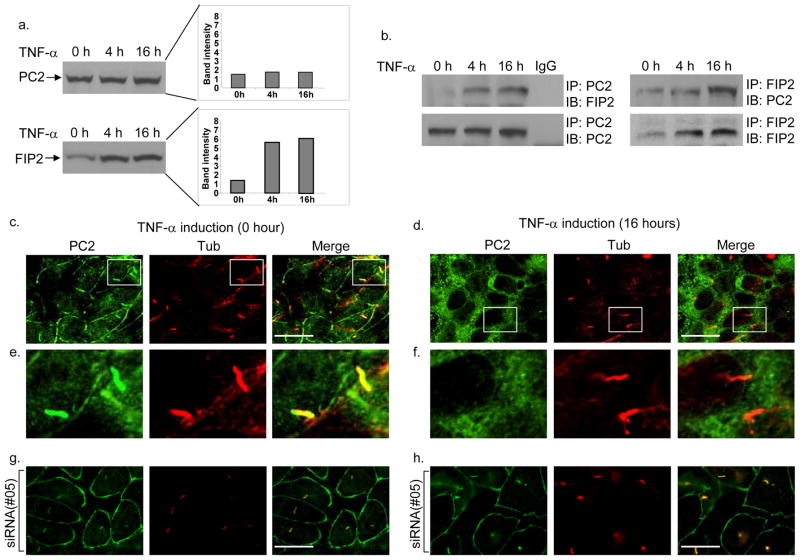
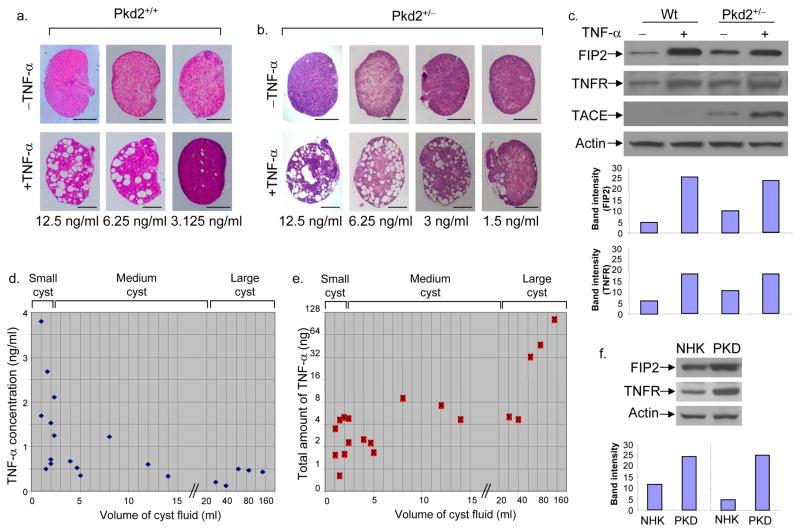
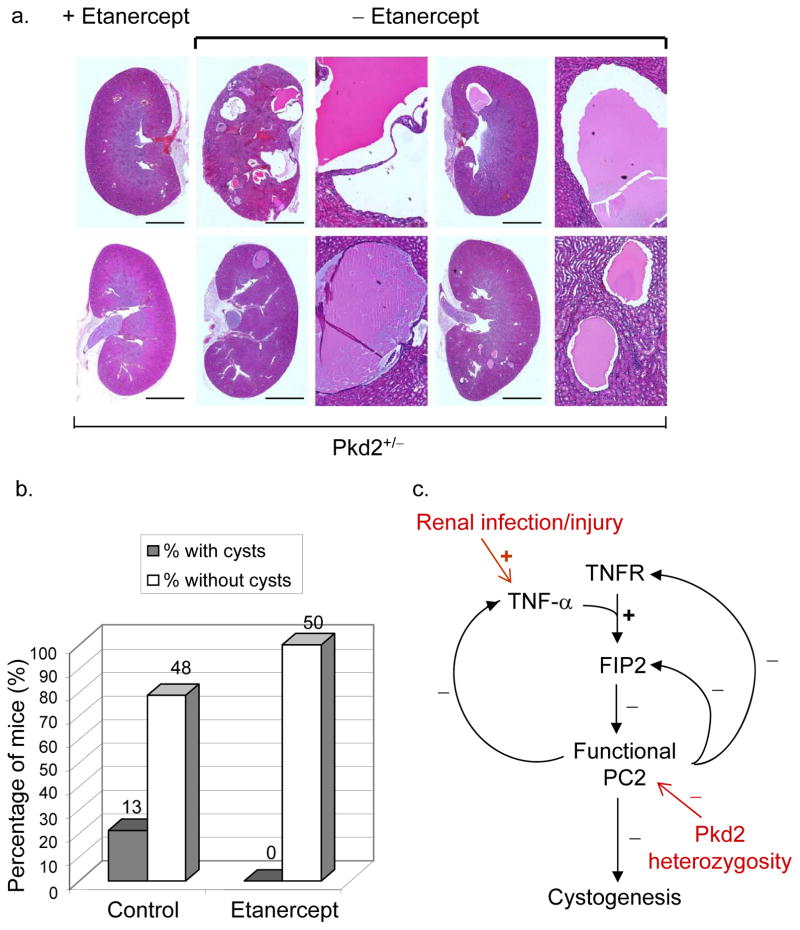
Autosomal dominant polycystic kidney disease (ADPKD) is caused by heterozygous mutations in either PKD1 or PKD2, genes that encode polycystin-1 and polycystin-2, respectively. We show here that tumor necrosis factor-alpha (TNF-alpha), an inflammatory cytokine present in the cystic fluid of humans with ADPKD, disrupts the localization of polycystin-2 to the plasma membrane and primary cilia through a scaffold protein, FIP2, which is induced by TNF-alpha. Treatment of mouse embryonic kidney organ cultures with TNF-alpha resulted in formation of cysts, and this effect was exacerbated in the Pkd2(+/-) kidneys. TNF-alpha also stimulated cyst formation in vivo in Pkd2(+/-) mice. In contrast, treatment of Pkd2(+/-) mice with the TNF-alpha inhibitor etanercept prevented cyst formation. These data reveal a pathway connecting TNF-alpha signaling, polycystins and cystogenesis, the activation of which may reduce functional polycystin-2 below a critical threshold, precipitating the ADPKD cellular phenotype.


Figures

Figure 1
Figure 1
Effects of TNF-α on FIP2 and PC2 in IMCD cells. a, Western blot analysis shows increased FIP2 protein levels but not PC2 protein levels upon TNF-α stimulation for 4 hr or 16 hr. b, Co-immunoprecipitation of endogenous FIP2 and PC2 with anti-PC2 or FIP2 antibody. TNF-α induction for 4 hr or 16 hr resulted in increased amounts of FIP2 pulled down with PC2, and PC2 pulled down with FIP2. IgG: control antibody. c and d, Double immunofluorescence staining of endogenous PC2 (green) and acetylated tubulin (tub, red) before (c) or after (d) treatment with TNF-α for 16 hr, observed with confocal microscopy. Scale bars, 10 μm. e and f, enlarged cilia images in the boxed regions in c and d, respectively. g and h, Transfection of siRNA#05 against FIP2 prevented TNF-α-induced mislocalization of PC2 in IMCD cells.
Figure 2
Figure 2
TNF-α triggers cyst formation in cultured embryonic kidneys and is present in human ADPKD cyst fluid. a, Treatment of wild-type cultured kidneys from E15.5 embryos with various concentrations of TNF-α for 5 days triggered cyst formation. Each vertical pair represents left and right kidneys from the same embryo. Scale bars, 500 μm. b, Treatment with different concentrations of TNF-α for 5 days triggered cyst formation in Pkd2+/− cultured kidneys from E15.5 embryos. Scale bars, 500 μm. c, Immunoblot analysis of FIP2, TNFR-I and TACE protein levels in wild-type and Pkd2+/− embryonic kidneys with or without TNF-α (6.25 ng/ml) stimulation for 5 days. The band intensity of FIP2 (top) and TNFR (bottom) are shown as histograms. d, e, Quantification of TNF-α levels in ADPKD human cysts by ELISA. The data represent 20 cysts from 10 ADPKD patients. The horizontal axis indicates cyst volumes; the vertical axis indicates TNF-α concentration (d); and the total TNF-α amount in each cyst (e). f, Immunoblot analysis of FIP2 and TNFR-I protein levels, comparing cultured normal human kidney (NHK) cells and ADPKD cyst lining (PKD). The band intensity of FIP2 (left) and TNFR (right) are shown as histograms.
Figure 3
Figure 3
TNF-α inhibitor, etanercept, prevents cyst formation in Pkd2+/− mice. a, Kidney histology sections from Pkd2+/− mice injected intraperitoneally, from week 8.5 to week 18.5, with etanercept at 125 μg/mouse/week (right column) or phosphate buffered saline (PBS) (middle and right columns). For control examples (-etanercept), the panel to the right of each kidney section displays an enlarged image of a cyst in that section. Scale bars, 4 mm. b, Quantitative result of etanercept treatment experiments. The number above each bar indicates the number of mice represented by the bar. p=0.0005 (Fisher’s exact test). c. A functional network connecting TNF-α signaling, polycystin complex and cystogenesis. Three double-negative feedback loops can be observed: between PC2 function and the physiological response that leads to TNF-α production; between PC2 level and FIP2 expression; between PC2 and TNFR expression. +: positive effect; −: negative effect. In red: genetic and non-genetic factors that could influence the pathway leading to cystogenesis.

References

    1. Wilson PD. Polycystic kidney disease. The New England journal of medicine. 2004;350:151–64. - PubMed
    1. Qian F, Watnick TJ, Onuchic LF, Germino GG. The molecular basis of focal cyst formation in human autosomal dominant polycystic kidney disease type I. Cell. 1996;87:979–87. - PubMed
    1. Lantinga-van Leeuwen IS, et al. Lowering of Pkd1 expression is sufficient to cause polycystic kidney disease. Hum Mol Genet. 2004;13:3069–77. - PubMed
    1. Martinez JR, Grantham JJ. Polycystic kidney disease: etiology, pathogenesis, and treatment. Dis Mon. 1995;41:693–765. - PubMed
    1. Pfeffer K. Biological functions of tumor necrosis factor cytokines and their receptors. Cytokine Growth Factor Rev. 2003;14:185–91. - PubMed

Publication types

MeSH terms