. 2008 Jul;14(7):762-6.
doi: 10.1038/nm1777. Epub 2008 Jun 15.

Dose-response curve slope sets class-specific limits on inhibitory potential of anti-HIV drugs

Affiliations

Dose-response curve slope sets class-specific limits on inhibitory potential of anti-HIV drugs

Lin Shen et al. Nat Med. 2008 Jul.

Abstract

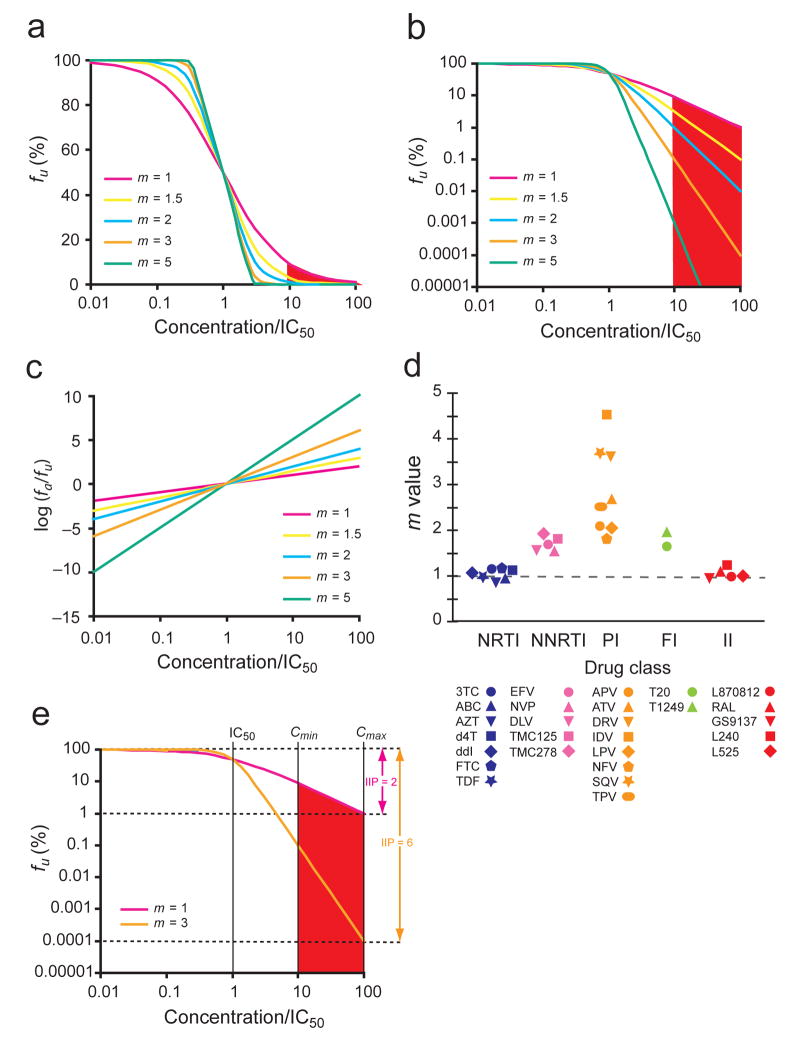
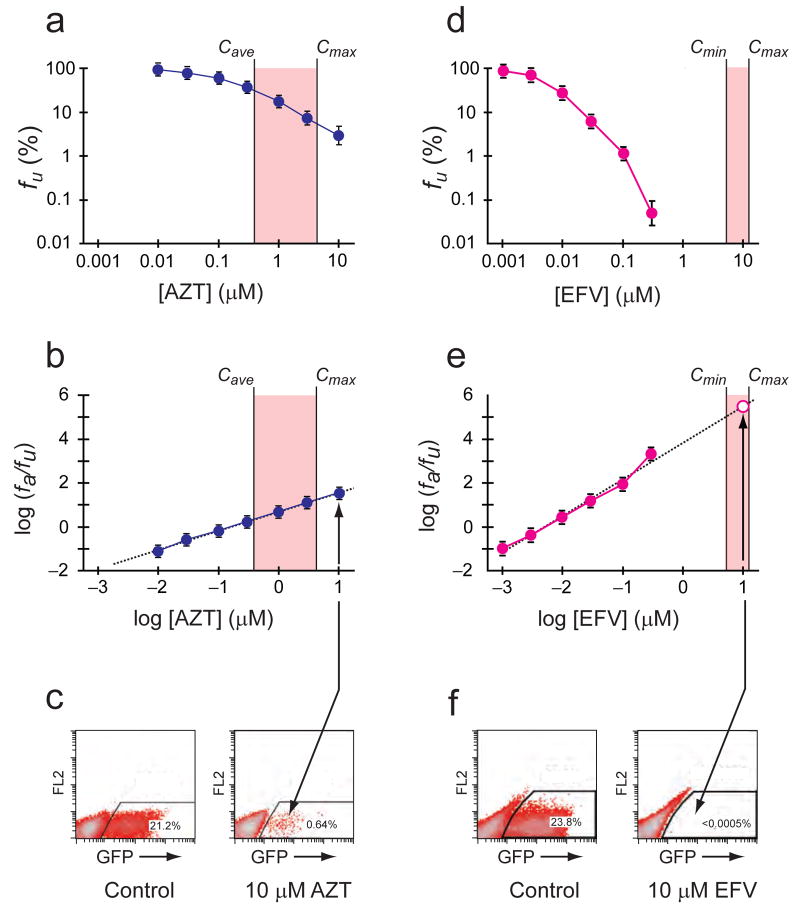
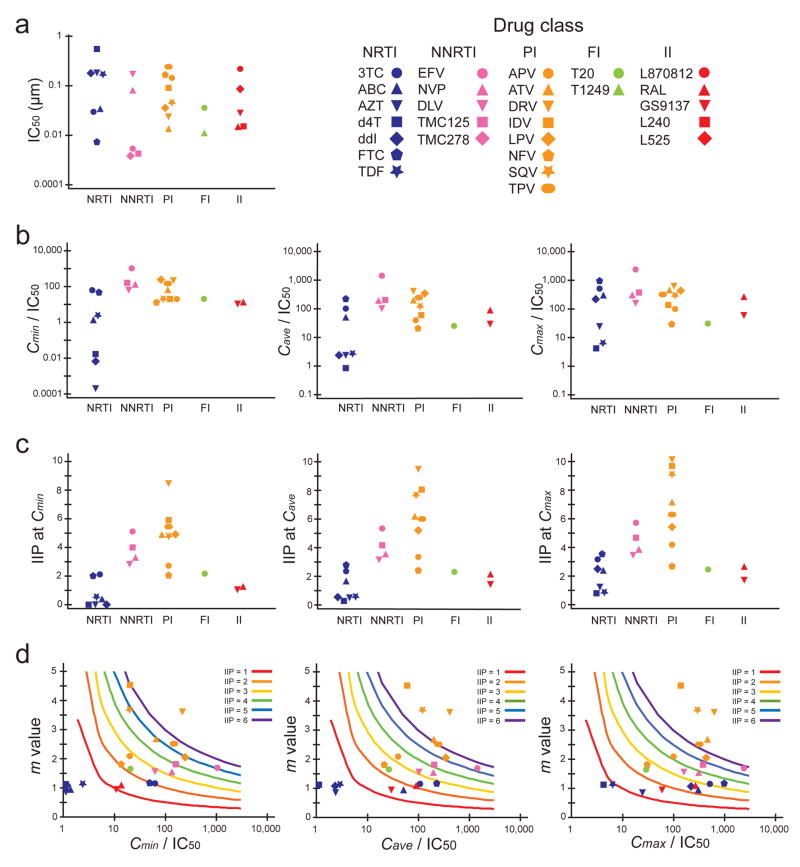
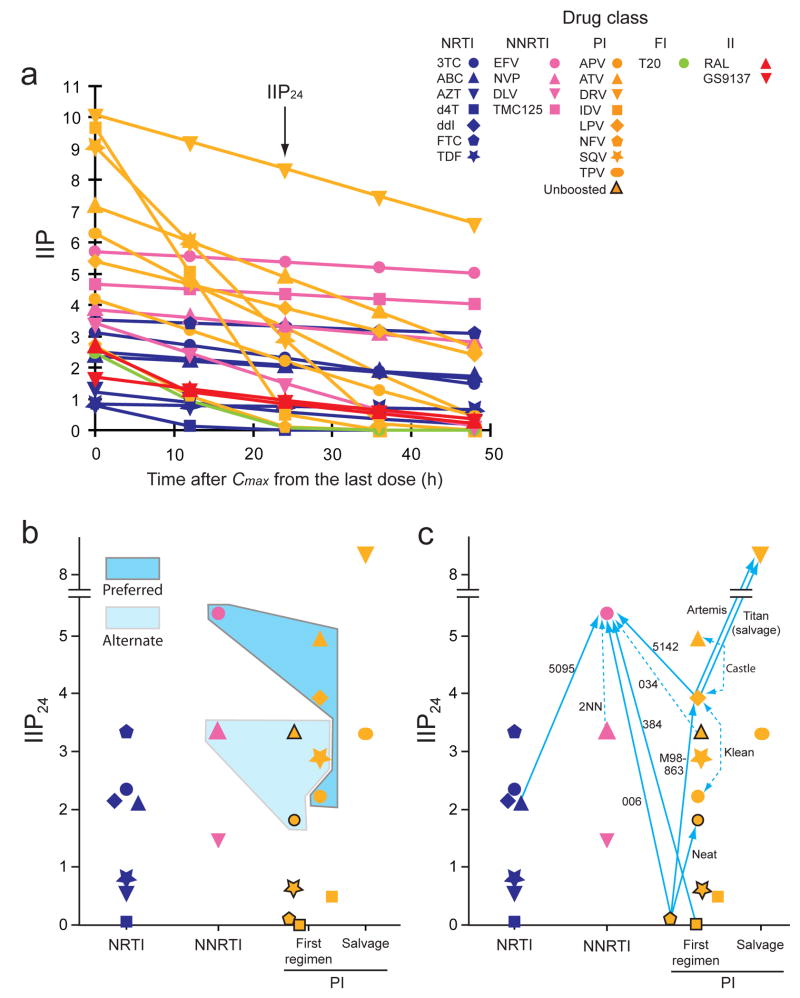
Highly active antiretroviral therapy (HAART) can control HIV-1 replication, but suboptimal treatment allows for the evolution of resistance and rebound viremia. A comparative measure of antiviral activity under clinically relevant conditions would guide drug development and the selection of regimens that maximally suppress replication. Here we show that current measures of antiviral activity, including IC(50) and inhibitory quotient, neglect a key dimension, the dose-response curve slope. Using infectivity assays with wide dynamic range, we show that this slope has noteworthy effects on antiviral activity. Slope values are class specific for antiviral drugs and define intrinsic limitations on antiviral activity for some classes. Nucleoside reverse transcriptase inhibitors and integrase inhibitors have slopes of approximately 1, characteristic of noncooperative reactions, whereas non-nucleoside reverse transcriptase inhibitors, protease inhibitors and fusion inhibitors unexpectedly show slopes >1. Instantaneous inhibitory potential (IIP), the log reduction in single-round infectivity at clinical drug concentrations, is strongly influenced by slope and varies by >8 logs for anti-HIV drugs. IIP provides a more accurate measure of antiviral activity and in general correlates with clinical outcomes. Only agents with slopes >1 achieve high-level inhibition of single-round infectivity, a finding with profound implications for drug and vaccine development.


Figures

Figure 1
Figure 1
Effect of slope (m) on dose-response curves of antiretroviral drugs. (a) Hypothetical linear-log plot of the fraction of viruses unaffected (fu) by a drug vs. drug concentration based on the median-effect model for drugs with different m values. Concentrations are normalized by IC50. A typical clinical concentration range 10–100 fold above the IC50 is shaded. (b) A log-log plot of the same curves emphasizing the strong impact of slope on the suppression of infectivity. (c) A median effect plot [log (fa/fu) vs. log drug concentration] (equation 1) of the same curves. The m value is the slope of the line. (d) Each class of anti-HIV-1 drugs has a characteristic slope. The m value for each drug was calculated by linear regression analysis using the median effect model. Each point is the average of more than three experiments. See Supplementary Table online for the mean values and standard deviations (s.d.). (e) Comparison of the antiviral activity of two hypothetical drugs with different m values. Instantaneous inhibitory potential (IIP) is the number of logs of suppression of single round infectivity at a clinically relevant drug concentration. At Cmax, the IIP of a drug with m = 3 is 10,000 fold greater than that of a drug with m = 1.
Figure 2
Figure 2
Measurement of IC50, m, and IIP. (a,d) Log-log dose-response curves for zinovudine (AZT) and efavirenz (EFV). 50% human serum and 10% fetal calf serum were included in the culture medium to account for protein binding of the drugs. Each point represents the mean±s.d. from more than three experiments. The clinical concentration range for each drug is shaded. Because of the short plasma half-life of the AZT prodrug, the range between Cave and Cmax is shown. Clinical concentrations of AZT produce inhibition that is readily measured by collecting ~50,000 events (live cells). In contrast, clinical concentrations of EFV produce inhibition that can only be measured with assays having a dynamic range of >5 logs. (b,e) Linearized dose-response curves for AZT and EFV based on median effect model. IIP at Cmin, Cave or Cmax was calculated using equations (3)–(5). For EFV, this is graphically equivalent to extrapolation of the median effect plot to higher concentrations (dashed line). To verify values obtained by extrapolation, large scale infections were carried out (open symbol, see below). (c,f) Verifying the IIP of EFV in large scale infections (~2 × 10⁶ events). In cultures with 10 μM AZT, infection events (GFP+ cells) were readily detectable. In cultures with 10μM EFV, less than three GFP+ cells were detected. This represents >5 logs of inhibition, consistent with the values predicted by extrapolation.
Figure 3
Figure 3
Comparison of indices used to describe antiviral activity for five classes of anti-HIV-1 drugs. (a) IC50 determined in the single round infectivity assay. IC50 was determined by least squares regression analysis of median effect plots. (b) IQ values (concentration/IC50) at Cmin, Cave, and Cmax. (c) IIP values at Cmin, Cave, and Cmax. IIP values were determined using equations (3)–(5) from measured IC50 and m values as described in Fig. 2. (d) Contour plots of m vs. IQ. Colored lines are theoretical IIP values representing 1–6 logs of inhibition of a single round of infection based on the median effect model. Note in Fig. 3c that 4 PIs produce >6 logs inhibition at Cmax, largely as a result of high m values. All the data points are the average of more than three experiments. Mean values and s.d. are shown in Supplementary Table online. NRTI data points with IQ values below the scale range were placed at the left edge of x axis in Fig. 3d.
Figure 4
Figure 4
Correlation of IIP with clinical outcome. (a) Predicted decay of IIP if subsequent doses are missed. IIP is plotted as a function of time after Cmax from the last dose. We calculated IIP using measured m and IC50 values (Supplementary Table online) and published t1/2 values. For NRTIs, we used t1/2 values for the active intracellular triphosphate forms. Drug levels are assumed to decay exponentially. The initial IIP decay rate is proportional to m/t1/2 (Supplementary Notes online). For drugs with high m values and short t1/2 such as indinavir and saquinavir, IIP drops dramatically if one or two doses are missed, whereas for drugs with long t1/2 such as EFV and DRV, IIP is maintained at a high level even if doses are missed. (b) Relationship between IIP24 values and recommended “Column A” drugs. Recommended initial HAART regimens consist of two NRTIs plus one highly active “Column A” drug. The IIP24 values for the preferred “Column A drugs” (dark shading) tend to be higher than those of the alternate “Column A” drugs (light shading) or non-“Column A” drugs. Data from unboosted PIs are indicated by symbols with a black border. (c) Relationship between IIP24 values and virologic outcomes in major clinical trials (Supplementary Notes online) cited in the treatment guidelines,, with trial titles given beside each arrow. Solid arrows point towards drugs with superior virologic activity in head-to-head comparisons with the same background regimens. Broken arrows indicate a trend towards superiority not reaching statistical significance. Double-headed arrows indicate equivalent virologic outcomes.

Similar articles

Cited by

References

    1. Gulick RM, et al. Treatment with indinavir, zidovudine, and lamivudine in adults with human immunodeficiency virus infection and prior antiretroviral therapy. N Engl J Med. 1997;337:734–739. - PubMed
    1. Hammer SM, et al. A controlled trial of two nucleoside analogues plus indinavir in persons with human immunodeficiency virus infection and CD4 cell counts of 200 per cubic millimeter or less. AIDS Clinical Trials Group 320 Study Team. N Engl J Med. 1997;337:725–733. - PubMed
    1. Ho DD, et al. Rapid turnover of plasma virions and CD4 lymphocytes in HIV-1 infection. Nature. 1995;373:123–126. - PubMed
    1. Wei X, et al. Viral dynamics in human immunodeficiency virus type 1 infection. Nature. 1995;373:117–122. - PubMed
    1. Preston BD, Poiesz BJ, Loeb LA. Fidelity of HIV-1 reverse transcriptase. Science. 1988;242:1168–1171. - PubMed

Publication types

MeSH terms