

Social coordination dynamics: measuring human bonding
- PMID: 18552971
- PMCID: PMC2156197
- DOI: 10.1080/17470910701563392
Social coordination dynamics: measuring human bonding
Abstract
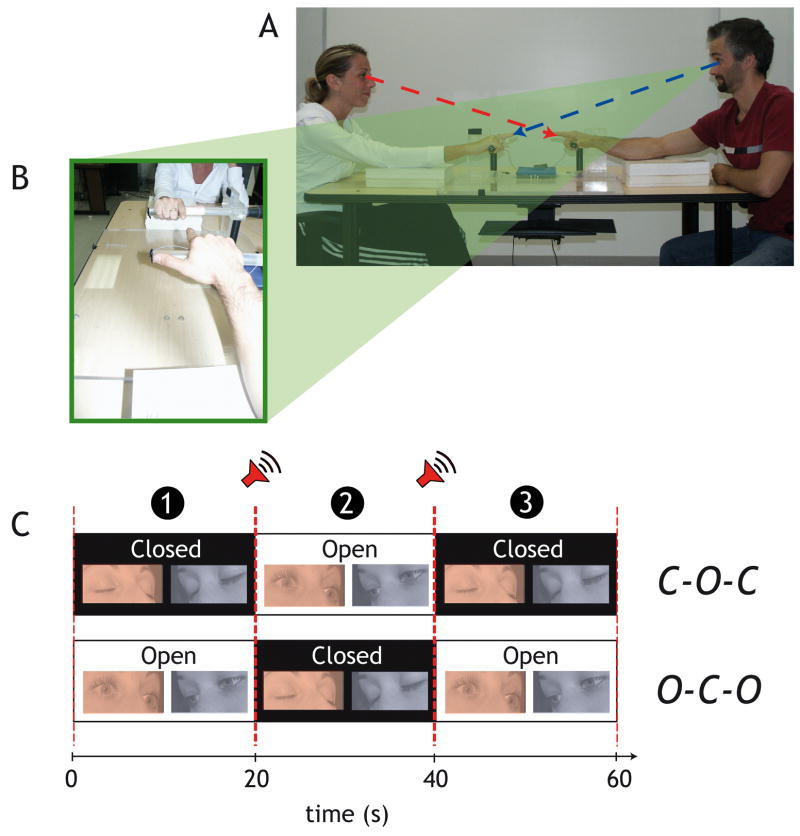
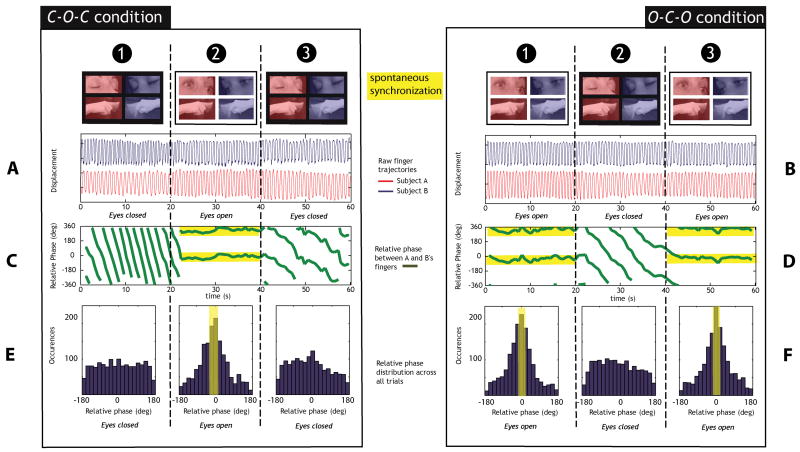
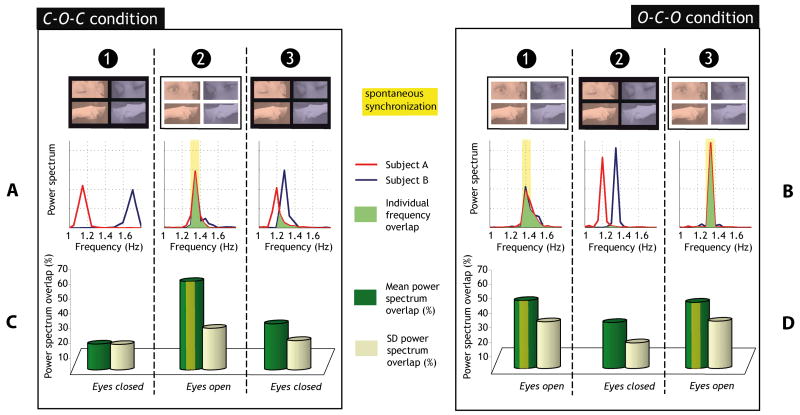
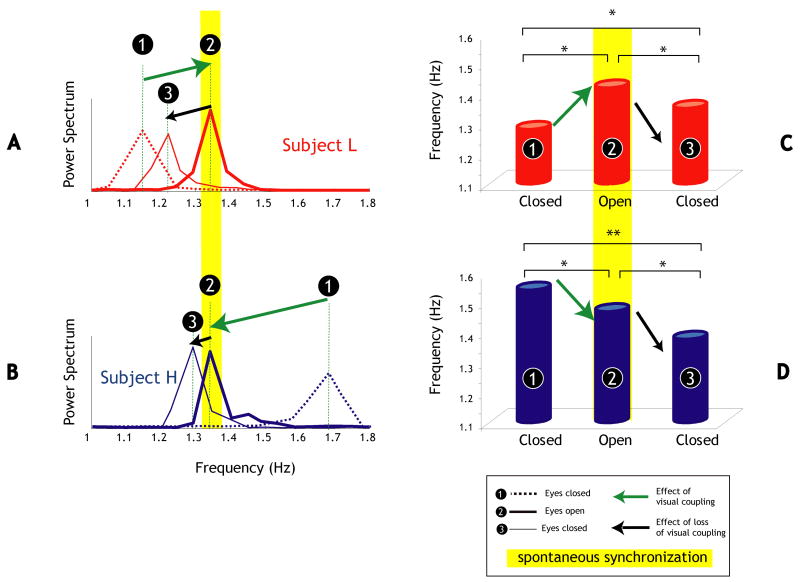
Spontaneous social coordination has been extensively described in natural settings but so far no controlled methodological approaches have been employed that systematically advance investigations into the possible self-organized nature of bond formation and dissolution between humans. We hypothesized that, under certain contexts, spontaneous synchrony-a well-described phenomenon in biological and physical settings-could emerge spontaneously between humans as a result of information exchange. Here, a new way to quantify interpersonal interactions in real time is proposed. In a simple experimental paradigm, pairs of participants facing each other were required to actively produce actions, while provided (or not) with the vision of similar actions being performed by someone else. New indices of interpersonal coordination, inspired by the theoretical framework of coordination dynamics (based on relative phase and frequency overlap between movements of individuals forming a pair) were developed and used. Results revealed that spontaneous phase synchrony (i.e., unintentional in-phase coordinated behavior) between two people emerges as soon as they exchange visual information, even if they are not explicitly instructed to coordinate with each other. Using the same tools, we also quantified the degree to which the behavior of each individual remained influenced by the social encounter even after information exchange had been removed, apparently a kind of social memory.
Keywords: Coupling; Emergence; Entrainment; Interpersonal; Social memory; Spontaneous Synchronization; Vision.
Figures
References
-
- Allison T, Puce A, McCarthy G. Social perception from visual cues: Role of the STS region. Trends in Cognitive Science. 2000;4:267–278. - PubMed
-
- Balaban E. Neurobiology - Why voles stick together. Nature. 2004;429:711–712. - PubMed
-
- Barsalou LW, Niedenthal PM, Barbey AK, Ruppert JA. Social embodiment. Psychology of Learning and Motivations - Advances in Research and Theory. 2003;43:43–92.
-
- Batschelet E. Circular statistics in biology. New York: Academic Press; 1981.
-
- Bennett M, Schatz MF, Rockwood H, Wiesenfeld K. Huygens’s clocks. Proceedings of the Royal Society of London Series A - Mathematical Physical and Engineering Sciences. 2002;458:563–579.
Publication types
MeSH terms
Grants and funding
LinkOut - more resources
Full Text Sources
Medical