. 2008 Jun 3:14:1050-63.

Time course profiling of the retinal transcriptome after optic nerve transection and optic nerve crush

Affiliations

Time course profiling of the retinal transcriptome after optic nerve transection and optic nerve crush

Marta Agudo et al. Mol Vis. .

Abstract

Purpose: A time-course analysis of gene regulation in the adult rat retina after intraorbital nerve crush (IONC) and intraorbital nerve transection (IONT).

Methods: RNA was extracted from adult rat retinas undergoing either IONT or IONC at increasing times post-lesion. Affymetrix RAE230.2 arrays were hybridized and analyzed. Statistically regulated genes were annotated and functionally clustered. Arrays were validated by means of quantative reverse transcription polymerase chain reaction (qRT-PCR) on ten regulated genes at two times post-lesion. Western blotting and immunohistofluorescence for four pro-apoptotic proteins were performed on naïve and injured retinas. Finally, custom signaling maps for IONT- and IONC-induced death response were generated (MetaCore, Genego Inc.).

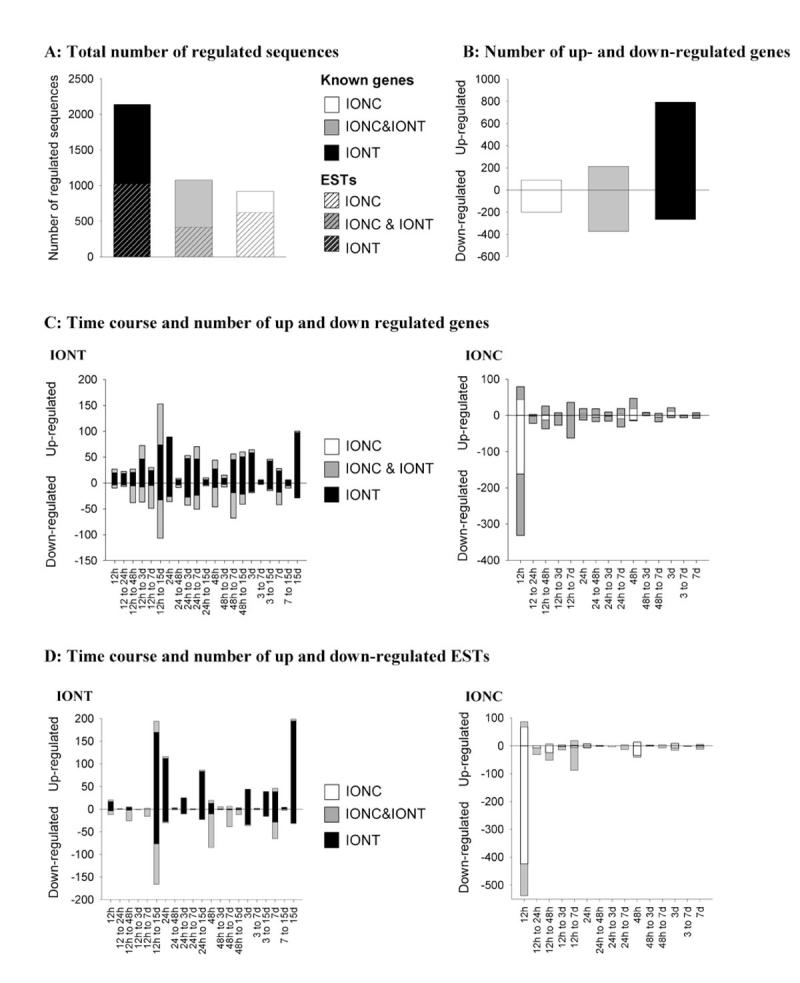
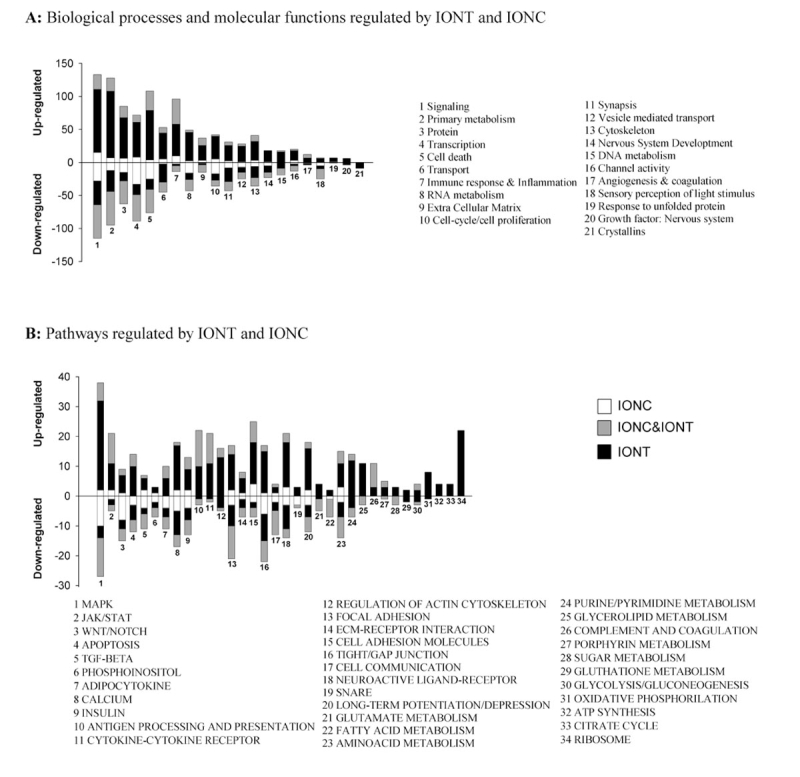
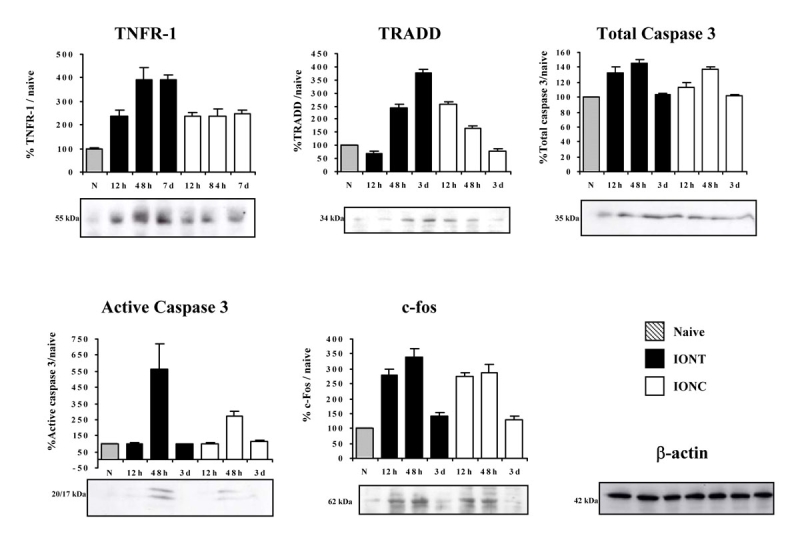
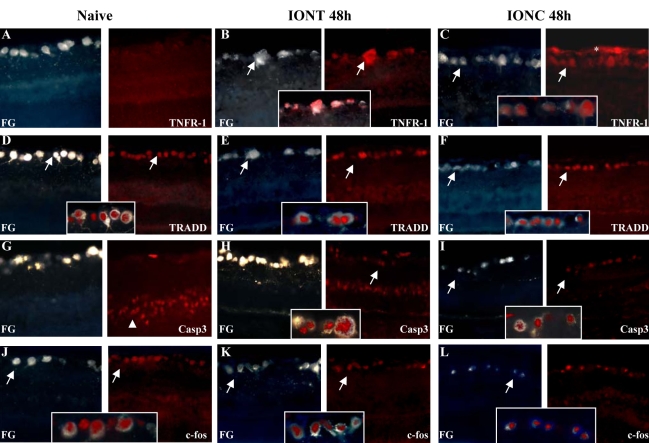
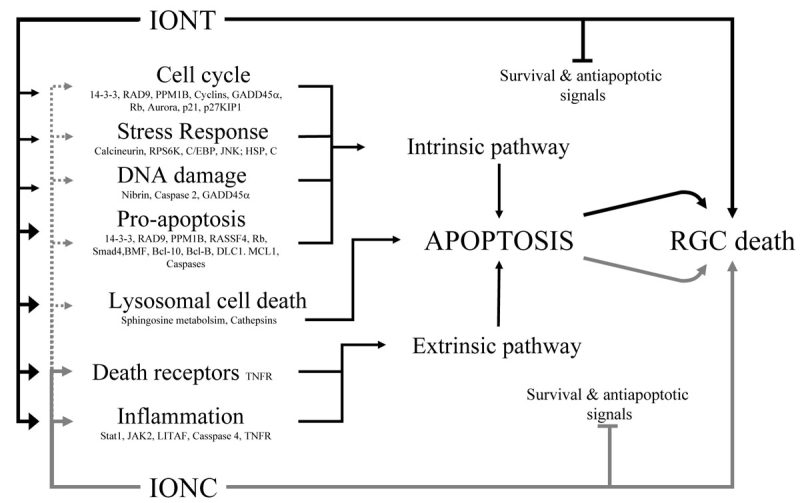
Results: Here we show that over time, 3,219 sequences were regulated after IONT and 1,996 after IONC. Out of the total of regulated sequences, 1,078 were commonly regulated by both injuries. Interestingly, while IONT mainly triggers a gene upregulation-sustained over time, IONC causes a transitory downregulation. Functional clustering identified the regulation of high interest biologic processes, most importantly cell death wherein apoptosis was the most significant cluster. Ten death-related genes upregulated by both injuries were used for array validation by means of qRT-PCR. In addition, western blotting and immunohistofluorescence of total and active Caspase 3 (Casp3), tumor necrosis factor receptor type 1 associated death domain (TRADD), tumor necrosis factor receptor superfamily member 1a (TNFR1a), and c-fos were performed to confirm their protein regulation and expression pattern in naïve and injured retinas. These analyses demonstrated that for these genes, protein regulation followed transcriptional regulation and that these pro-apoptotic proteins were expressed by retinal ganglion cells (RGCs). MetaCore-based death-signaling maps show that several apoptotic cascades were regulated in the retina following optic nerve injury and highlight the similarities and differences between IONT and IONC in cell death profiling.

Conclusions: This comprehensive time course retinal transcriptome study comparing IONT and IONC lesions provides a unique valuable tool to understand the molecular mechanisms underlying optic nerve injury and to design neuroprotective protocols.


Figures

Figure 1
Figure 1
Time course and number of sequences regulated after optic nerve injury in the adult rat retina. A: Graph depicting the total number of sequences regulated in the retina specifically by intraorbital nerve transection (IONT; black columns), specifically by intraorbital nerve crush (IONC; white columns) and commonly by both lesions (gray columns) B: In this graph is shown the number of genes specifically up or down-regulated in the retina by IONT (black columns), specifically up or down-regulated by IONC (white columns) and commonly up or down-regulated by both lesions (gray columns). C: Graph on the left illustrates the time course and number of genes up or down-regulated in the retina at each time after IONT (black bars represent genes specifically regulated by transection and gray bars genes regulated by transection and crush). Graph on the right illustrates the time course and number of genes up or down-regulated in the retina at each time after IONC (white bars represent genes specifically regulated by crush and gray bars genes regulated by transection and crush). D: Graph on the left illustrates time course and number of expressed sequence tags (ESTs) up or down-regulated in the retina at each time after IONT (black bars represent ESTs specifically regulated by transection and gray bars ESTs regulated by transection and crush). Graph on the right illustrates the time course and number of ESTs up or down-regulated in the retina at each time after IONC (white bars represent ESTs specifically regulated by crush and gray bars ESTs regulated by transection and crush). In C and D the regulated sequences (either genes or ESTs) were clustered according to when they started to show regulation and how long they were regulated either at one time point (12 h, 24 h, etc) or at several (regulated from 12 h to 24 h, from 12 h to day 3, etc). The number of upregulated sequences is shown in the positive y-axis and number of downregulated ones in the negative y-axis. All sequences were significantly regulated (p value FDR <0,01 and a B value >0) compared to naïve expression levels.
Figure 2
Figure 2
Functional clustering of genes regulated after optic nerve injury in the adult rat retina. A: Graph showing which biologic processes and molecular functions are regulated by intraorbital nerve transection (IONT) and intraorbital nerve crush (IONC) in the adult rat retina and the number of up and down-regulated genes in each one. B: Graph showing which pathways are regulated by IONT and IONC in the adult rat retina and the number of up- and down-regulated genes in each one. From 1 to 9: pathways related to cell signaling; from 10 to 11 pathways related to inflammation and immune system; from 12 to 16 pathways related to cytoskeleton; from 17 to 21 pathways related to synapse and from 22 to 25, and 27 to 32 pathways related to basic metabolism. Clusters with a pEASE value <1.00E-04 were considered significant. Black bars represent the number of genes of a given cluster specifically regulated by IONT, white bars specifically regulated by IONC and gray bars commonly regulated by both lesions. The number of upregulated genes in each cluster is shown in the positive y-axis and number of downregulated ones in the negative y-axis Abbreviations: IONT: intraorbital nerve transection. IONC: intraorbital nerve crush.
Figure 3
Figure 3
Time course regulation of cell death–related proteins in naïve and optic nerve injured retinas. Western blot time course analyses showing the regulation of tumor necrosis factor receptor superfamily member 1a (TNFR1a), tumor necrosis factor receptor type 1, associated death domain (TRADD), total Caspase 3, active Caspase 3, and c-fos in naïve, intraorbital nerve transection (IONT)-, and intraorbital nerve crush (IONC)-injured retinas. Graphs show quantification of protein signals (n=4 animals per lesion and time point, western blots were replicated three times). The signal from injured retinas is referred to the naïve signal, which was arbitrarily considered 100%. To verify the amount of loaded protein, western blots were incubated with β-actin (an example is shown). Error bars show the standard error of the mean (SEM) for each experiment.
Figure 4
Figure 4
Expression pattern of cell death–related proteins in naïve and optic nerve injured retinas. Immunohistofluorescence analyses for tumor necrosis factor receptor superfamily member 1a (TNFR1a), tumor necrosis factor receptor type 1, associated death domain (TRADD), Caspase 3, and c-fos to fluorogold-traced retinas in naïve, intraorbital nerve transection (IONT) and intraorbital nerve crush (IONC) injured retinas. A-C: Expression pattern of TNFR1a (red signal) in naïve retinas (A, right), IONT-injured retinas (B, right) and IONC-injured retinas (C, right). Left images are the corresponding fluorogold (FG) images (blue signal). D-F: Expression pattern of TRADD (red signal) in naïve retinas (D, right), IONT-injured retinas (E, right) and IONC-injured retinas (F, right). Left images are the corresponding fluorogold (FG) images (blue signal). G-I: Expression pattern of Caspase 3 (red signal) in naïve retinas (G, right), IONT-injured retinas (H, right) and IONC-injured retinas (I, right). Left images are the corresponding fluorogold (FG) images (blue signal). J-L: Expression pattern of c-fos (red signal) in naïve retinas (J, right), IONT-injured retinas (K, right) and IONC-injured retinas (L, right). Left images are the corresponding fluorogold (FG) images (blue signal). Magnifications in squares show the co-localization of a given protein with FG-labeled retinal ganglion cells (RGCs). Arrows point to RGC, arrowheads indicate the outer nuclear layer and asterisks mark the nerve layer.
Figure 5
Figure 5
Scheme summarizing the retinal response to intraorbital nerve transection and intraorbital nerve crush leading to cell death. Black lines correspond to intraorbital nerve transection (IONT) and gray ones to intraorbital nerve crush (IONC). Thicker arrowheads symbolize that more genes of a given process are regulated. Dotted lines represent that IONC regulates fewer genes in a process than IONT does. See text for explanation and Appendix 4 for gene interaction and time course regulation.

Similar articles

Cited by

References

    1. Kermer P, Klocker N, Weishaupt JH, Bahr M. Transection of the optic nerve in rats: studying neuronal death and survival in vivo. Brain Res Brain Res Protoc. 2001;7:255–60. - PubMed
    1. Berkelaar M, Clarke DB, Wang YC, Bray GM, Aguayo AJ. Axotomy results in delayed death and apoptosis of retinal ganglion cells in adult rats. J Neurosci. 1994;14:4368–74. - PMC - PubMed
    1. Parrilla-Reverter G. Sobrado, P., Mayor, S., Canovas, I., Aguilera, M.E., Lambrou, G.N., Latour. E., Villegas-Pérez, M.P., Vidal-Sanz, M (2004) Intraorbital optic nerve crush induces progressive retinal ganglion cell loss ARVO Annual Meeting; 2004 April 25–29; Fort Lauderdale (FL).
    1. Parrilla-Reverter G. Sobrado, P., Mayor, S., Canovas, I., Bernal, J.M. Soro, M.I., Aguilera, M.E. Villegas-Pérez, M.P., Vidal-Sanz, M (2006) Retinal ganglion cell axotzomy induced by intraorbital nerve crush or optic nerve transection results in different time course degeneration and expression of neurofilaments ARVO Annual Meeting; 2006 April 30-May 4; Fort Lauderdale (FL).
    1. Villegas-Perez MP, Vidal-Sanz M, Rasminsky M, Bray GM, Aguayo AJ. Rapid and protracted phases of retinal ganglion cell loss follow axotomy in the optic nerve of adult rats. J Neurobiol. 1993;24:23–36. - PubMed

Publication types