

Epicardial wavefronts arise from widely distributed transient sources during ventricular fibrillation in the isolated swine heart
- PMID: 18552988
- PMCID: PMC2429991
- DOI: 10.1088/1367-2630/10/1/015004
Epicardial wavefronts arise from widely distributed transient sources during ventricular fibrillation in the isolated swine heart
Abstract
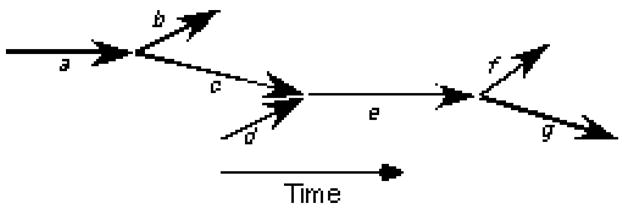
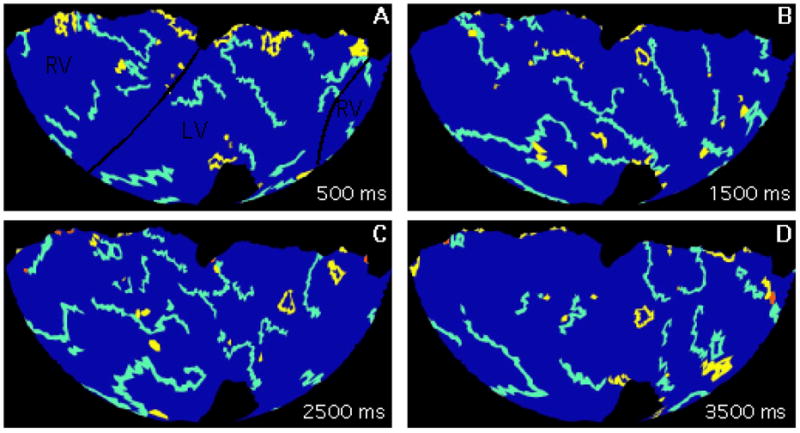
It has been proposed that VF waves emanate from stable localized sources, often called "mother rotors." However, evidence for the existence of these rotors is conflicting. Using a new panoramic optical mapping system that can image nearly the entire ventricular epicardium, we recently excluded epicardial mother rotors as the drivers of Wiggers' stage II VF in the isolated swine heart. Furthermore, we were unable to find evidence that VF requires sustained intramural sources. The present study was designed to test the following hypotheses: 1. VF is driven by a specific region, and 2. Rotors that are long-lived, though not necessarily permanent, are the primary generators of VF wavefronts. Using panoramic optical mapping, we mapped VF wavefronts from 6 isolated swine hearts. Wavefronts were tracked to characterize their activation pathways and to locate their originating sources. We found that the wavefronts that participate in epicardial reentry were not confined to a compact region; rather they activated the entire epicardial surface. New wavefronts feeding into the epicardial activation pattern were generated over the majority of the epicardium and almost all of them were associated with rotors or repetitive breakthrough patterns that lasted for less than 2 s. These findings indicate that epicardial wavefronts in this model are generated by many transitory epicardial sources distributed over the entire surface of the heart.
Figures
Similar articles
-
Panoramic optical mapping reveals continuous epicardial reentry during ventricular fibrillation in the isolated swine heart.Biophys J. 2007 Feb 1;92(3):1090-5. doi: 10.1529/biophysj.106.092098. Epub 2006 Nov 10. Biophys J. 2007. PMID: 17098797 Free PMC article.
-
Epicardial rotors in panoramic optical maps of fibrillating swine ventricles.Conf Proc IEEE Eng Med Biol Soc. 2006;2006:2268-71. doi: 10.1109/IEMBS.2006.260635. Conf Proc IEEE Eng Med Biol Soc. 2006. PMID: 17946949
-
Lifetimes of epicardial rotors in panoramic optical maps of fibrillating swine ventricles.Am J Physiol Heart Circ Physiol. 2006 Oct;291(4):H1935-41. doi: 10.1152/ajpheart.00276.2006. Epub 2006 Apr 21. Am J Physiol Heart Circ Physiol. 2006. PMID: 16632545 Free PMC article.
-
Our search for the porcine mother rotor.Ann Noninvasive Electrocardiol. 2005 Oct;10(4 Suppl):7-15. doi: 10.1111/j.1542-474X.2005.00071.x. Ann Noninvasive Electrocardiol. 2005. PMID: 16274411 Free PMC article. Review.
-
Spatial and temporal organization in ventricular fibrillation.Trends Cardiovasc Med. 1999 Jul;9(5):119-27. doi: 10.1016/s1050-1738(99)00019-5. Trends Cardiovasc Med. 1999. PMID: 10639726 Review.
Cited by
-
Dynamics of spatiotemporal line defects and chaos control in complex excitable systems.Sci Rep. 2017 Aug 10;7(1):7757. doi: 10.1038/s41598-017-08011-z. Sci Rep. 2017. PMID: 28798384 Free PMC article.
-
RHYTHM: An Open Source Imaging Toolkit for Cardiac Panoramic Optical Mapping.Sci Rep. 2018 Feb 13;8(1):2921. doi: 10.1038/s41598-018-21333-w. Sci Rep. 2018. PMID: 29440763 Free PMC article.
-
Verapamil reduces incidence of reentry during ventricular fibrillation in pigs.Am J Physiol Heart Circ Physiol. 2014 Nov 1;307(9):H1361-9. doi: 10.1152/ajpheart.00256.2014. Epub 2014 Aug 29. Am J Physiol Heart Circ Physiol. 2014. PMID: 25172897 Free PMC article.
References
-
- Moe GK, Reinboldt WC, Abildskov JA. A computer model of atrial fibrillation. American Heart Journal. 1964;67:200–20. - PubMed
-
- Chen J, Mandapati R, Berenfeld O, Skanes AC, Jalife J. High frequency periodic sources underlie ventricular fibrillation in the isolated rabbit heart. Circulation Research. 2000;86:86–93. - PubMed
-
- Samie FH, Berenfeld O, Anumonwo J, Mironov SF, Udassi S, Beaumont J, Taffet S, Pertsov AM, Jalife J. Rectification of the Background Potassium Current: A Determinant of Rotor Dynamics in Ventricular Fibrillation. Circulation Research. 2001;89:1216–23. - PubMed
-
- Zaitsev AV, Berenfeld O, Mironov SF, Jalife J, Pertsov AM. Distribution of excitation frequencies on the epicardial and endocardial surfaces of fibrillating ventricular wall of the sheep heart. Circulation Research. 2000;86:408–17. - PubMed
-
- Winfree AT. When Time Breaks Down. Princeton: Princeton University Press; 1987.
Grants and funding
LinkOut - more resources
Full Text Sources