. 2008 Jun 13:1:26.
doi: 10.1186/1755-8794-1-26.

Whole genome assessment of the retinal response to diabetes reveals a progressive neurovascular inflammatory response

Affiliations

Whole genome assessment of the retinal response to diabetes reveals a progressive neurovascular inflammatory response

Robert M Brucklacher et al. BMC Med Genomics. .

Abstract

Background: Despite advances in the understanding of diabetic retinopathy, the nature and time course of molecular changes in the retina with diabetes are incompletely described. This study characterized the functional and molecular phenotype of the retina with increasing durations of diabetes.

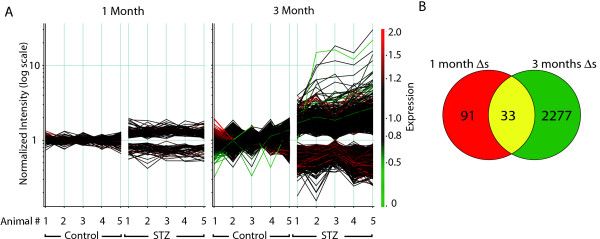
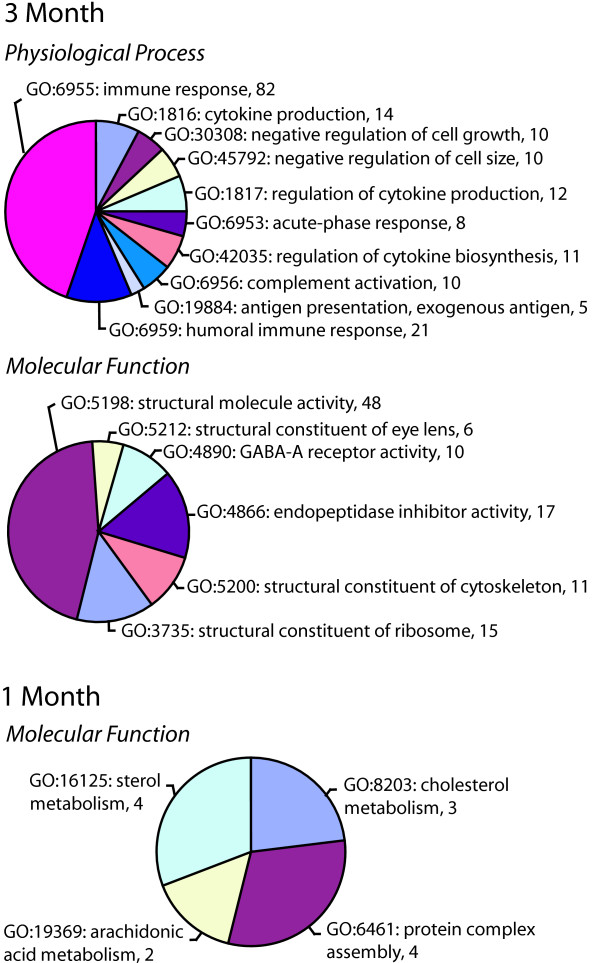
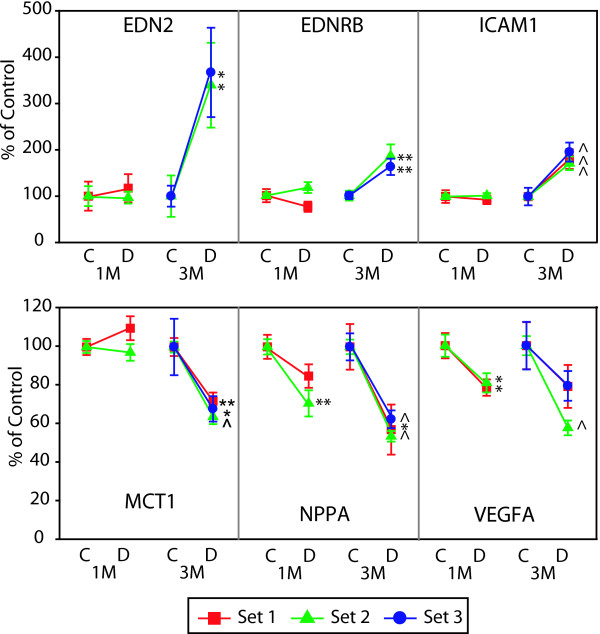
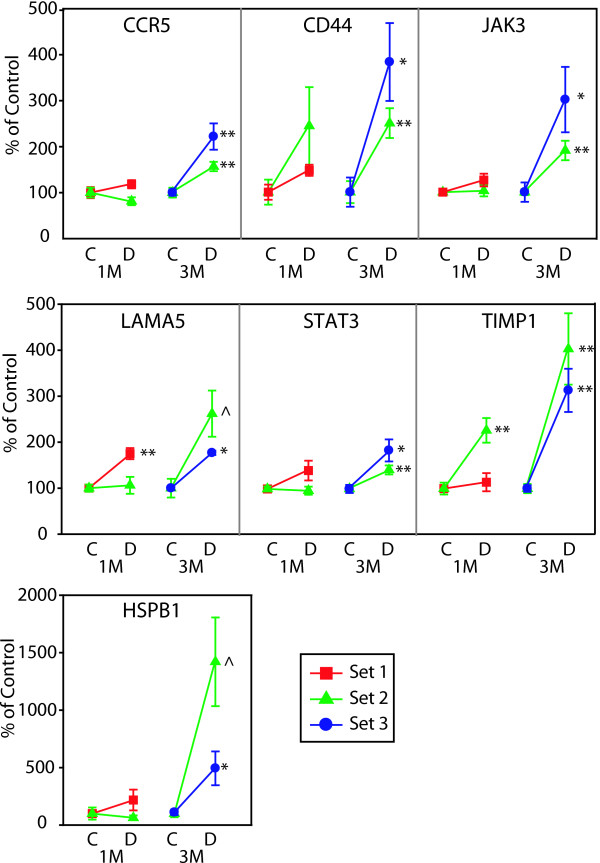
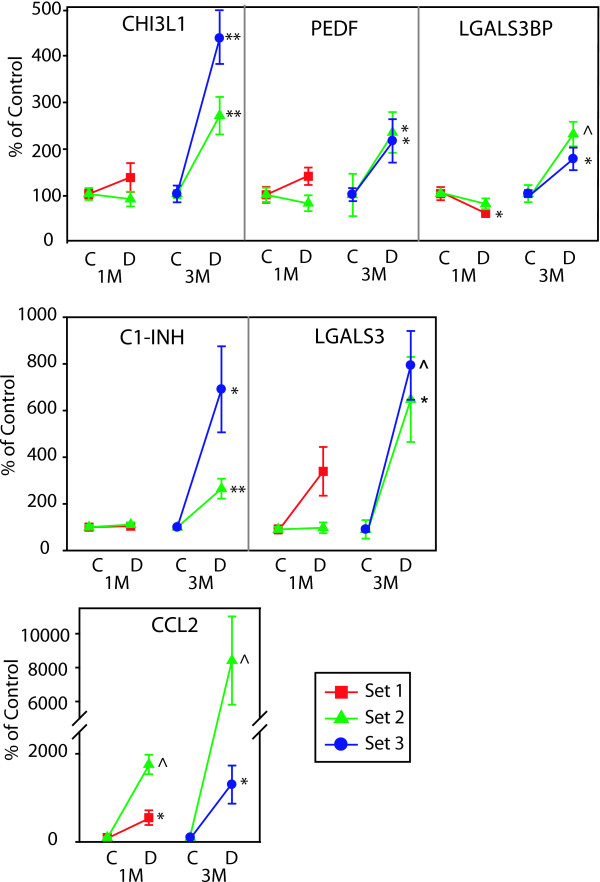
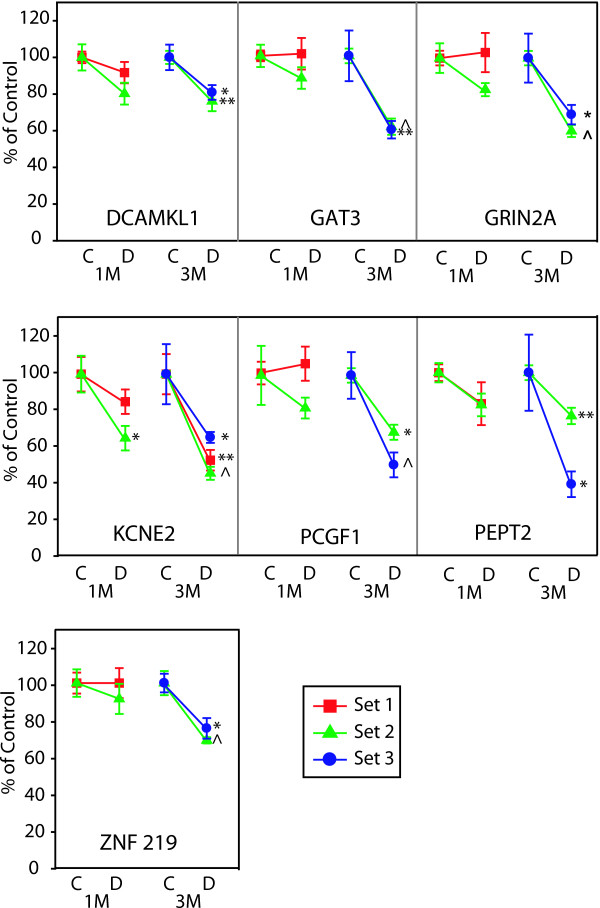
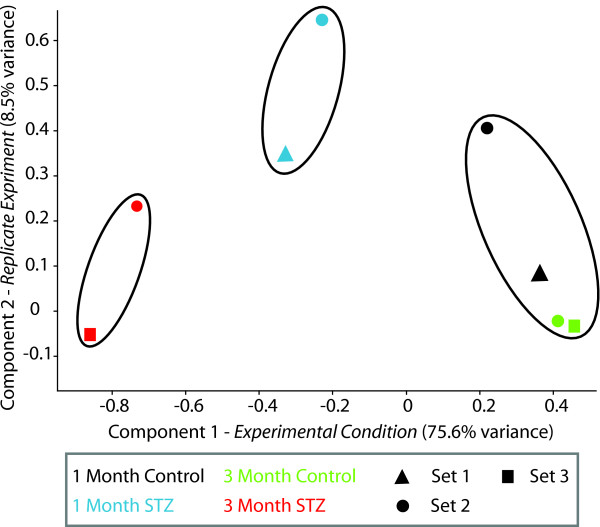
Results: Using the streptozotocin-induced rat model of diabetes, levels of retinal permeability, caspase activity, and gene expression were examined after 1 and 3 months of diabetes. Gene expression changes were identified by whole genome microarray and confirmed by qPCR in the same set of animals as used in the microarray analyses and subsequently validated in independent sets of animals. Increased levels of vascular permeability and caspase-3 activity were observed at 3 months of diabetes, but not 1 month. Significantly more and larger magnitude gene expression changes were observed after 3 months than after 1 month of diabetes. Quantitative PCR validation of selected genes related to inflammation, microvasculature and neuronal function confirmed gene expression changes in multiple independent sets of animals.

Conclusion: These changes in permeability, apoptosis, and gene expression provide further evidence of progressive retinal malfunction with increasing duration of diabetes. The specific gene expression changes confirmed in multiple sets of animals indicate that pro-inflammatory, anti-vascular barrier, and neurodegenerative changes occur in tandem with functional increases in apoptosis and vascular permeability. These responses are shared with the clinically documented inflammatory response in diabetic retinopathy suggesting that this model may be used to test anti-inflammatory therapeutics.


Figures

Figure 1
Figure 1
Microarray analysis. A. Differences in RNA expression 1 or 3 months after STZ induced diabetes were analyzed by Codelink whole genome microarray. After filtering for genes detected as present, differential expression was determined by ANOVA p < 0.01 and a fold change of 1.2 fold or greater. For differentially expressed genes values for each of the five animals in control and STZ treated groups are given in log scale normalized as described in the Methods. Lines are colored according to their relative normalized expression level. Far more changes and larger magnitude changes were detected after 3 months of STZ-induced diabetes as opposed to 1 month. B. Set analysis of the changes at 1 month and 3 months of STZ-induced diabetes demonstrates that the vast majority of 3 month changes are not observed at 1 month of STZ-induced diabetes.
Figure 2
Figure 2
Ontological analysis of 1 month and 3 month microarray changes. Gene Ontology (GO) categories were queried for statistically significant overabundances of specific physiological processes or molecular functions. Statistical analysis was performed by taking the number of members of each process or function on the array and determining the number of changes that would be in that process by random chance. Processes or functions with a p value < 0.01 are given with GO accession #, function or process name and number of genes in that function or process. No statistically altered physiological processes were found for 1 month changes.
Figure 3
Figure 3
qPCR confirmation of microvascular-related gene changes across multiple sets of animals. qPCR data is normalized to give mean control values of 1 and the different sets are color coded per the inset. T-test, *p < 0.05, **p < 0.01, ^p < 0.001. EDN2, endothelin 2; EDNRB, endothelin receptor type B; ICAM1, intercellular adhesion molecule 1; MCT1, monocarboxylate transporter 1; NPPA, natriuretic peptide precursor type A; VEGFA, vascular endothelial growth factor A.
Figure 4
Figure 4
qPCR confirmation of inflammation-related gene changes across multiple sets of animals. qPCR data is normalized to give mean control values of 1 and the different sets are color coded per the inset. T-test, *p < 0.05, **p < 0.01, ^p < 0.001. CCR5, chemokine (C-C motif) receptor 5; CD44, cell surface glycoprotein CD44; HSPB1, heat shock 27 kDa protein 1; JAK3, janus kinase 3; LAMA5, laminin, alpha 5; STAT3, signal transducer and activator of transcription 3; TIMP1, tissue inhibitor of metalloproteinase 1.
Figure 5
Figure 5
qPCR confirmation of inflammation-related genes previously reported in patients with DR. qPCR data is normalized to give mean control values of 1 and the different sets are color coded per the inset. T-test, *p < 0.05, **p < 0.01, ^p < 0.001. C1-INH, complement component 1 inhibitor; CCL2, chemokine (C-C motif) ligand 2; ChI3L1, chitinase 3-like 1; LGALS3, lectin, galactoside-binding, soluble, 3; LGALS3BP, lectin, galactoside-binding, soluble, 3, binding protein; PEDF, pigment epithelium-derived factor.
Figure 6
Figure 6
qPCR confirmation and validation of neuronal function-related genes with consistent changes in multiple sets of animals. qPCR data is normalized to give mean control values of 1 and the different sets are color coded per the inset. T-test, *p < 0.05, **p < 0.01, ^p < 0.001. DCAMKL1, doublecortin-like kinase 1; KCNE2, potassium voltage-gated channel, Isk-related family, member 2; PCGF1, polycomb group ring finger 1; PEPT2, proton-dependent high affinity oligopeptide transporter; GAT3, Gamma-aminobutyric transporter 3; ZNF 219, zinc finger protein 219.
Figure 7
Figure 7
Condition clustering using qPCR data. qPCR data from the set of 26 validated genes in the previous figures was clustered by principle components analysis (PCA) to provide a visualization of the relationship between treatments and experiment sets. The 1st component, corresponding to the experimental treatment accounted for 75.6% of the variance, while the replicate set of animals were separated by the 2nd component, accounting for 8.5% of the variance. Of note is that the 1 and 3 month STZ groups separate from the control animals and from each other, suggesting that a pattern of altered expression is beginning at 1 month. A high degree of similarity was evident between all of the control groups. Set 1 3 month data is not included because values for all genes could not be collected.

References

    1. The effect of intensive treatment of diabetes on the development and progression of long-term complications in insulin-dependent diabetes mellitus. The Diabetes Control and Complications Trial Research Group. N Engl J Med. 1993;329:977–986. doi: 10.1056/NEJM199309303291401. - DOI - PubMed
    1. Mohamed Q, Gillies MC, Wong TY. Management of diabetic retinopathy: a systematic review. JAMA. 2007;298:902–916. doi: 10.1001/jama.298.8.902. - DOI - PubMed
    1. Aiello LP, Davis MD, Girach A, Kles KA, Milton RC, Sheetz MJ, Vignati L, Zhi XE. Effect of ruboxistaurin on visual loss in patients with diabetic retinopathy. Ophthalmology. 2006;113:2221–2230. doi: 10.1016/j.ophtha.2006.07.032. - DOI - PubMed
    1. Ng EW, Shima DT, Calias P, Cunningham ET, Jr., Guyer DR, Adamis AP. Pegaptanib, a targeted anti-VEGF aptamer for ocular vascular disease. Nat Rev Drug Discov. 2006;5:123–132. doi: 10.1038/nrd1955. - DOI - PubMed
    1. Herold K, Moser B, Chen Y, Zeng S, Yan SF, Ramasamy R, Emond J, Clynes R, Schmidt AM. Receptor for advanced glycation end products (RAGE) in a dash to the rescue: inflammatory signals gone awry in the primal response to stress. J Leukoc Biol. 2007 - PubMed