. 2008;9(6):R99.
doi: 10.1186/gb-2008-9-6-r99. Epub 2008 Jun 14.

Identification of transcripts with enriched expression in the developing and adult pancreas

Affiliations

Identification of transcripts with enriched expression in the developing and adult pancreas

Brad G Hoffman et al. Genome Biol. 2008.

Abstract

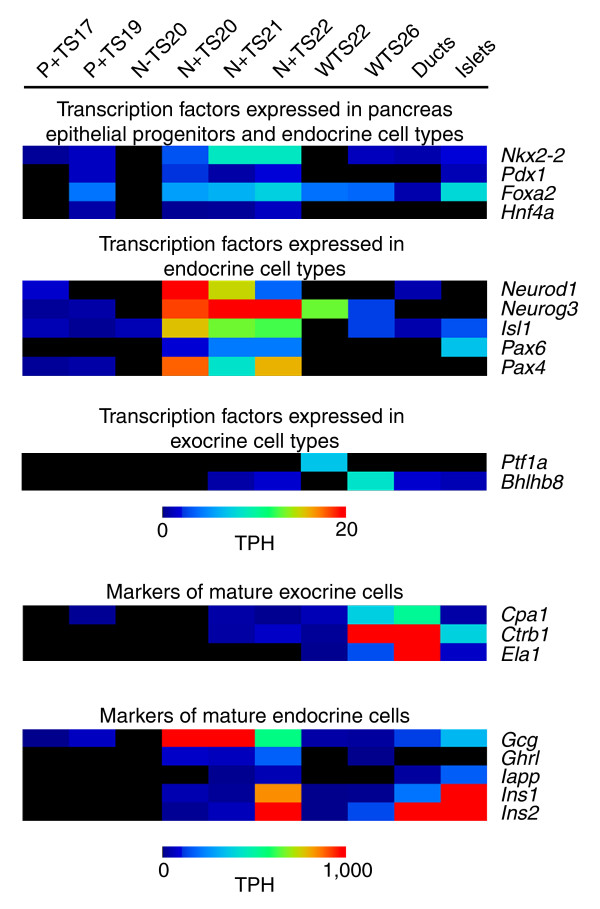
Background: Despite recent advances, the transcriptional hierarchy driving pancreas organogenesis remains largely unknown, in part due to the paucity of comprehensive analyses. To address this deficit we generated ten SAGE libraries from the developing murine pancreas spanning Theiler stages 17-26, making use of available Pdx1 enhanced green fluorescent protein (EGFP) and Neurog3 EGFP reporter strains, as well as tissue from adult islets and ducts.

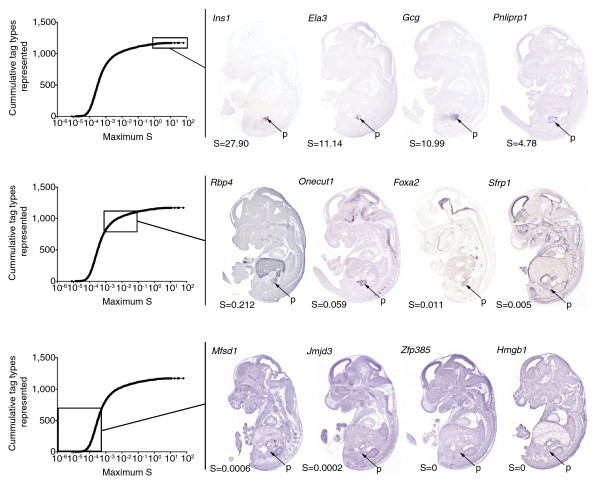
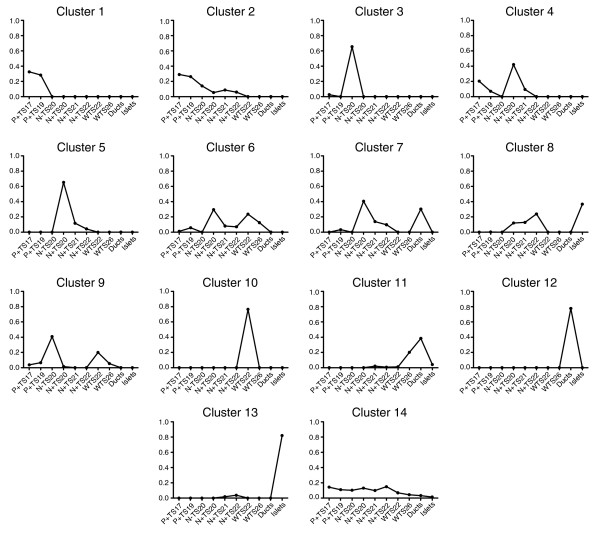
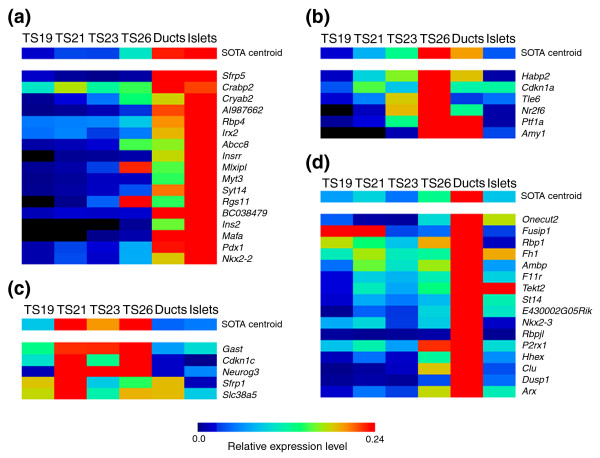
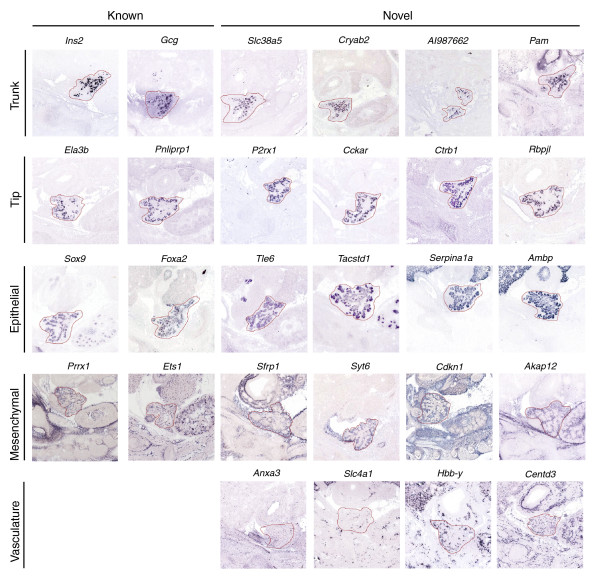
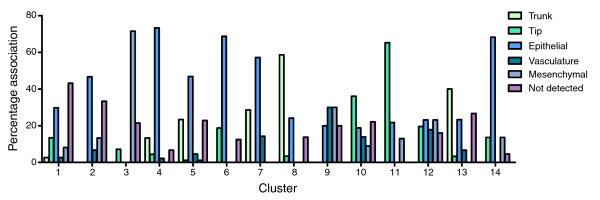
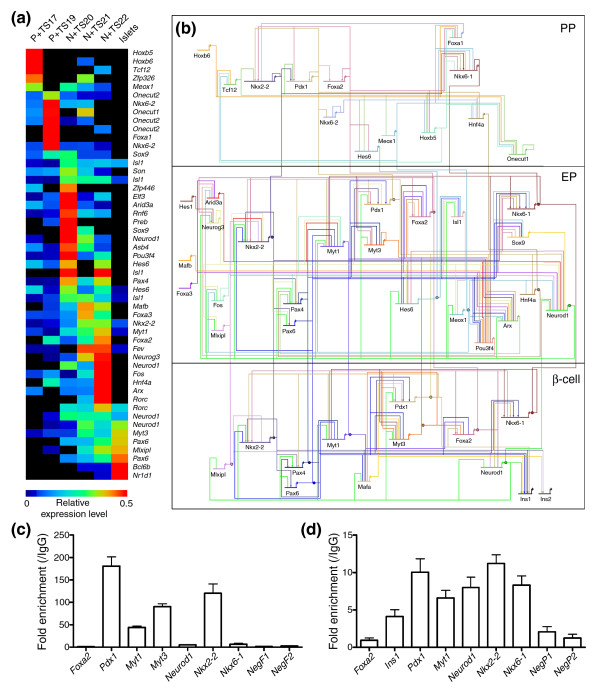
Results: We used a specificity metric to identify 2,536 tags with pancreas-enriched expression compared to 195 other mouse SAGE libraries. We subsequently grouped co-expressed transcripts with differential expression during pancreas development using K-means clustering. We validated the clusters first using quantitative real time PCR and then by analyzing the Theiler stage 22 pancreas in situ hybridization staining patterns of over 600 of the identified genes using the GenePaint database. These were then categorized into one of the five expression domains within the developing pancreas. Based on these results we identified a cascade of transcriptional regulators expressed in the endocrine pancreas lineage and, from this, we developed a predictive regulatory network describing beta-cell development.

Conclusion: Taken together, this work provides evidence that the SAGE libraries generated here are a valuable resource for continuing to elucidate the molecular mechanisms regulating pancreas development. Furthermore, our studies provide a comprehensive analysis of pancreas development, and insights into the regulatory networks driving this process are revealed.


Figures

Figure 1
Figure 1
Heatmap of SAGE tag counts for genes with known expression profiles in pancreas development. Tags for genes with well characterized expression profiles in pancreas development were identified and their normalized counts obtained in each of the ten SAGE libraries created. A heatmap, generated using the multi-experiment viewer as described in the Materials and methods, of these results is shown based on the counts of the tags per hundred thousand (TPH). SAGE tags used include: TACACGTTCTGACAACT (Nkx2-2); AAGTGGAAAAAAGAGGA (Pdx1); TAGTTTTAACAGAAAAC (Foxa2); ACCTTCACACCAAACAT (Hnf4a); AATGCAGAGGAGGACTC (Neurod1); CAGGGTTTCTGAGCTTC (Neurog3); TCATTTGACTTTTTTTT (Isl1); GATTTAAGAGTTTTATC (Pax6); CAGCAGGACGGACTCAG (Pax4); CAGTCCATCAACGACGC (Ptf1a); AGAAACAGCAGGGCCTG (Bhlhb8); GACCACACTGTCAAACA (Cpa1); CCCTGGGTTCAGGAGAT (Ctrb1); TTGCGCTTCCTGGTGTT (Ela1); ACCACCTGGTAACCGTA (Gcg); GCCGGGCCCTGGGGAAG (Ghrl); CTAAGAATTGCTTTAAA (Iapp); GCCCTGTTGGTGCACTT (Ins1); TCCCGCCGTGAAGTGGA (Ins2). The libraries shown include: Pdx1 EGFP+ TS17 (P+ TS17); Pdx1 EGFP+ TS19 (P+ TS19); Neurog3 EGFP- TS20 (N- TS20); Neurog3 EGFP+ TS20 (N+ TS20); Neurog3 EGFP+ TS21 (N+ TS21); Neurog3 EGFP+ TS22 (N+ TS22); whole pancreas TS22 (WTS22); whole pancreas TS26 (WTS26); adult isolated ducts (Ducts); adult isolated islets (Islets).
Figure 2
Figure 2
Specificity threshold accurately predicts spatial expression restriction. A plot of specificity (S) versus cumulative tag types represented shows the distribution of tags into tags with high (S > 0.1; top), medium (0.001 > S < 0.1, middle), and low (S < 0.001, bottom) S values. Representative in situ hybridization staining patterns from TS22 whole embryo saggital sections obtained from GenePaint are shown for each specificity group. Relevant GenePaint probe IDs can be found in Additional data file 4. Arrows indicate the location of the pancreas (p).
Figure 3
Figure 3
Median plots of identified SAGE tag K-means cluster analysis using 14 clusters. We clustered 2, 536 SAGE tags with a count greater than 4 in one of the SAGE libraries and with a minimum specificity of 0.002 and that map unambiguously to a specific transcript or genome location into 14 clusters using K-means clustering using a PoissonC algorithm as described in the Materials and methods. The median normalized tag counts for the tags in each of the clusters is shown plotted against the indicated SAGE libraries. The libraries shown include: Pdx1 EGFP+ TS17 (P+ TS17); Pdx1 EGFP+ TS19 (P+ TS19); Neurog3 EGFP- TS20 (N- TS20); Neurog3 EGFP+ TS20 (N+ TS20); Neurog3 EGFP+ TS21 (N+ TS21); Neurog3 EGFP+ TS22 (N+ TS22); whole pancreas TS22 (WTS22); whole pancreas TS26 (WTS26); adult isolated ducts (Ducts); adult isolated islets (Islets). A full list of the tags, the cluster they belong to, and their counts in each of the libraries is shown in Additional data file 2.
Figure 4
Figure 4
SOTA clustering of temporal expression profiles from qRT-PCR analysis of 44 genes in pancreas development. qRT-PCR was used to determine the relative expression levels of the indicated genes during pancreas development at the TSs indicated. The relative level of expression of each gene was normalized and a SOTA analysis used to group the genes. Heatmaps of the relative expression levels of the genes in the SOTA groups, including the SOTA centroid, with peak expression in (a) the islets, (b) the TS26 developing pancreas, (c) the TS21-TS26 developing pancreas, or (d) the ducts are shown. The data shown are averages of the results obtained from pancreases from three separate litters (pancreases from an individual litter were pooled) or islet/duct collections with triplicate reactions from the separate RNA extractions.
Figure 5
Figure 5
Representative in situ staining patterns for genes expressed in each of the identified expression profiles. Representative genes for each of the identified spatial expression profiles, including genes with known and previously un-described, or novel, staining profiles in pancreas development, are shown. For this, images of in situ hybridization staining patterns for whole embryo sagittal sections were obtained from the GenePaint website and magnified to show the pancreas (outlined in red). Relevant GenePaint probe IDs can be found in Additional data file 4.
Figure 6
Figure 6
The percent association of genes in each K-means cluster with the five expression domains in the pancreas. The in situ hybridization staining profiles of 605 genes with informative stain in TS22 pancreas tissue were classified into the groups shown using the GenePaint database. Additional data file 4 lists the full categorization of each of these genes. The percentage of genes with each staining profile in each of the SAGE tag K-means cluster is shown.
Figure 7
Figure 7
A cascade of transcription factors expressed in endocrine cell development. Tags that mapped unambiguously to transcription factors and met our count and specificity thresholds were identified and their normalized counts obtained in each of the SAGE libraries that represent the development of the endocrine lineage. (a) A heatmap, generated using the multi-experiment viewer as described in the Materials and methods, of these results is shown. Tags are organized by the order of their expression in the libraries. The libraries shown include: Pdx1 EGFP+ TS17 (P+ TS17); Pdx1 EGFP+ TS19 (P+ TS19); Neurog3 EGFP+ TS20 (N+ TS20); Neurog3 EGFP+ TS21 (N+ TS21); Neurog3 EGFP+ TS22 (N+ TS22); adult isolated islets (Islets). (b) A transcription factor network in β-cell development. The network was generated as described in the materials and methods using Biotapestry to visualize the network [65]. Ins1 and Ins2 are shown as the final products expressed in mature β-cells. Literature reported interactions [8,41] are included with arrow heads indicating positive regulation and perpendicular lines repression. Interactions in pancreatic progenitors (PP), endocrine progenitors (EP) and mature β-cells are shown. (c) The fold enrichment of predicted Foxa2 binding sites, as detected by qPCR, in the promoters of Pdx1, Myt1, Myt3, Neurod1, Nkx2-2, Nkx6-1, and of two sites not predicted to contain a Foxa2 site (NegF1 and NegF2) in ChIP experiments using an anti-Foxa2 antibody compared to IgG. (d) The fold enrichment of predicted Pdx1 binding sites, as detected by qPCR, in the promoters of Foxa2, Ins1, Myt1, Neurod1, Nkx2-2, Nkx6-1, and of two sites not predicted to contain a Pdx1 site (NegP1 and NegP2) in ChIP experiments using an anti-Pdx1 antibody compared to IgG. The data shown are averages of the results obtained from three separate ChIP experiments each with duplicate reactions. Error bars indicate the standard deviation of the averaged replicates.

Similar articles

Cited by

References

    1. Edlund H. Pancreatic organogenesis--developmental mechanisms and implication for therapy. Nat Rev Genet. 2002;3:524–532. doi: 10.1038/nrg841. - DOI - PubMed
    1. Lammert E, Brown J, Melton DA. Notch gene expression during pancreatic organogenesis. Mech Dev. 2000;94:199–203. doi: 10.1016/S0925-4773(00)00317-8. - DOI - PubMed
    1. Jensen J, Pedersen EE, Galante P, Hald J, Heller R, Ishibashi M, Kegeyama R, Guillemot F, Serup P, Madsen OD. Control of endodermal endocrine development by Hes-1. Nat Genet. 2000;24:36–44. doi: 10.1038/72814. - DOI - PubMed
    1. Edlund H. Transcribing pancreas. Diabetes. 1998;47:1817–1823. doi: 10.2337/diabetes.47.12.1817. - DOI - PubMed
    1. Edlund H. Pancreas: how to get there from the gut? Curr Opin Cell Biol. 1999;11:663–668. doi: 10.1016/S0955-0674(99)00033-2. - DOI - PubMed

Publication types

Substances

LinkOut - more resources