Review
. 2008 May;18(4):141-9.
doi: 10.1016/j.tcm.2008.04.001.

Bioinformatics assessment of beta-myosin mutations reveals myosin's high sensitivity to mutations

Affiliations
Review

Bioinformatics assessment of beta-myosin mutations reveals myosin's high sensitivity to mutations

Massimo Buvoli et al. Trends Cardiovasc Med. 2008 May.

Erratum in

  • Trends Cardiovasc Med. 2010 May;20(4):141

Abstract

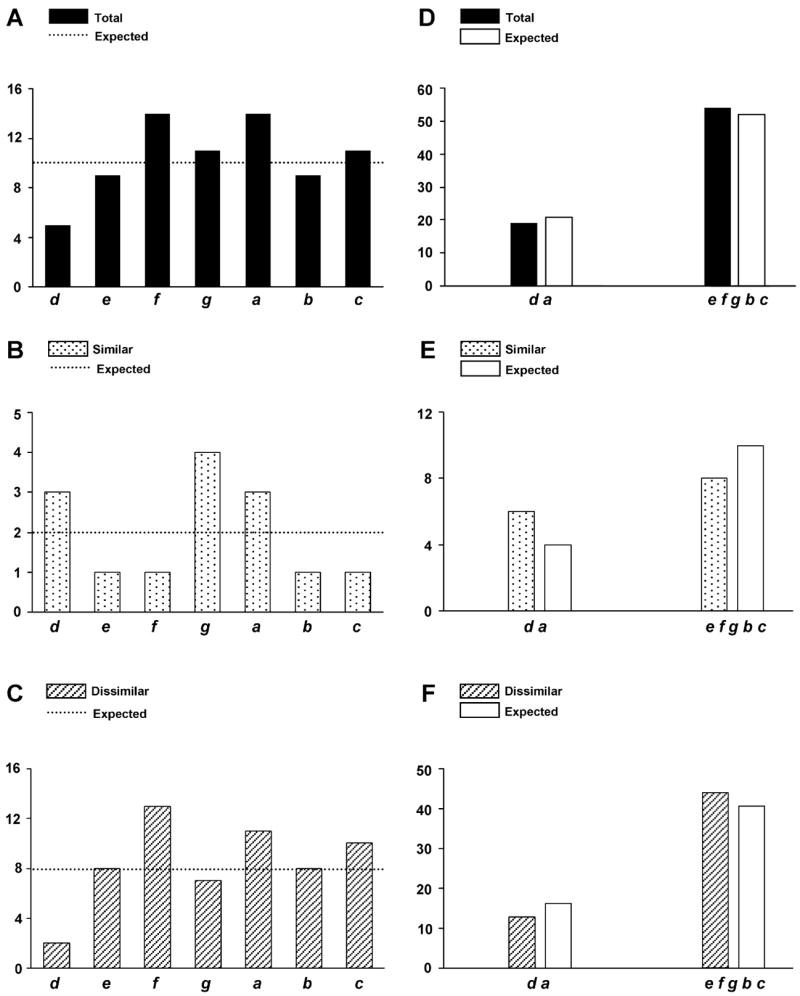
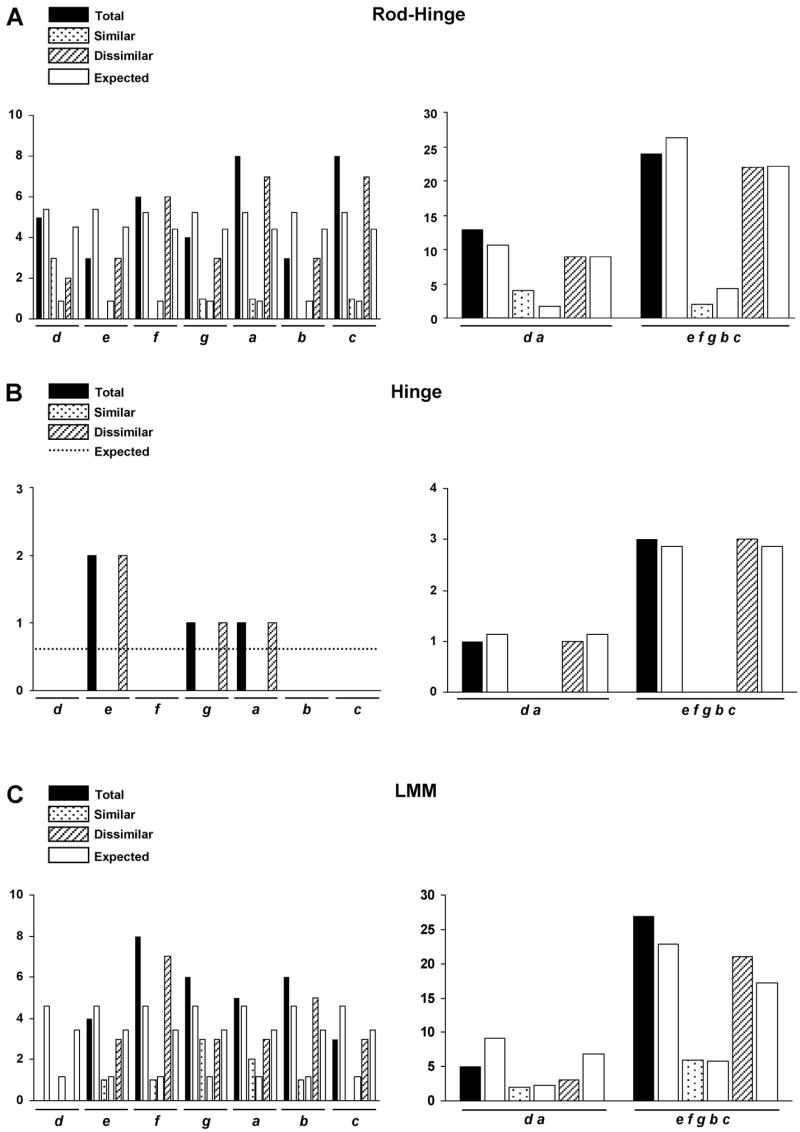
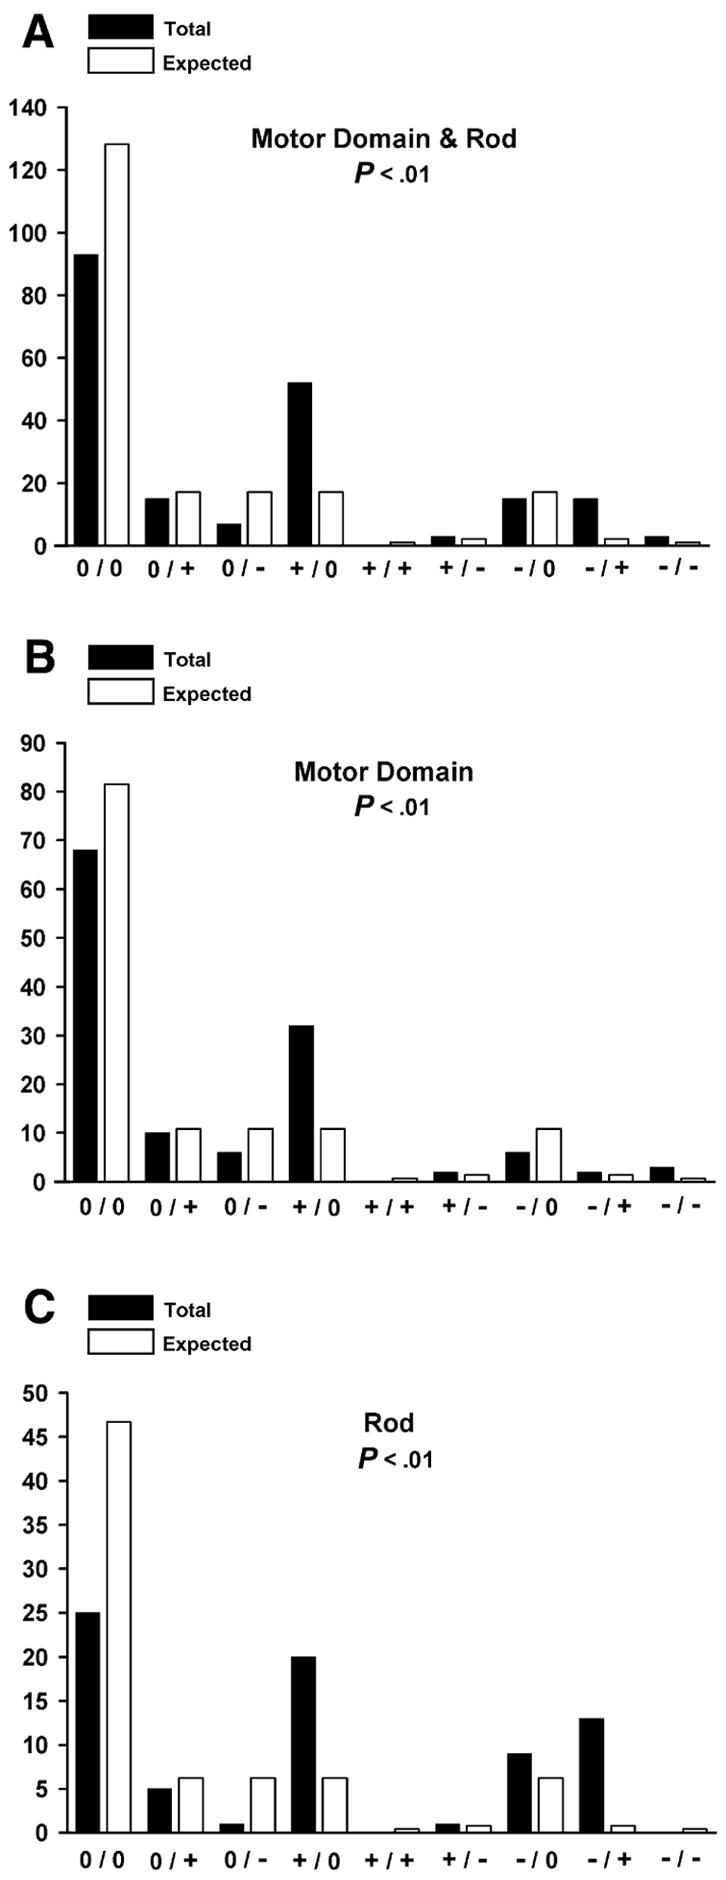
More than 200 mutations in the beta-myosin gene (MYH7) that cause clinically distinct cardiac and/or skeletal myopathies have been reported, but to date, no comprehensive statistical analysis of these mutations has been performed. As a part of this review, we developed a new interactive database and research tool called MyoMAPR (Myopathic Mutation Analysis Profiler and Repository). We report that the distribution of mutations along the beta-myosin gene is not homogeneous, and that myosin is a highly constrained molecule with an uncommon sensitivity to amino acid substitutions. Increasing knowledge of the characteristics of MH7 mutations may provide a valuable resource for scientists and clinicians studying diagnosis, risk stratification, and treatment of disease associated with these mutations.


Figures

Figure 1
Figure 1
Mapping of myosin motor domain and rod domain mutations. Black columns correspond to the total number of observed mutations (similar plus dissimilar), dotted and striped columns correspond to the number of similar and dissimilar observed mutations, respectively. White columns correspond to the theoretical number of expected mutations. (A) Distribution of total mutations present in the myosin motor domain and rod. * indicates that the observed number of mutations is significantly different than expected (p < 0.01). (B) This analysis was carried out using a scanning smoothing window of 56 amino acids. The x-axis corresponds to the amino acid position; the y-axis corresponds to the number of mutations. The boundary between the motor domain and rod is shown at the top of the graph. (C) Number of similar and dissimilar mutations present in the whole myosin molecule. * indicates that the observed number of mutations is significantly different than expected (p < 0.05). (D) Number of similar and dissimilar mutations present in the motor domain. * indicates that the observed number of mutations is significantly different than expected (p < 0.01) (E) Number of similar and dissimilar mutations present in the rod. * indicates that the observed number of mutations is significantly different than expected (p < 0.05).
Figure 2
Figure 2
Analysis of mutations located in the motor domain. Black columns correspond to the total number of observed mutations (similar plus dissimilar), dotted and striped columns correspond to the number of similar and dissimilar observed mutations, respectively. White columns correspond to the theoretical number of expected mutations. (A) Distribution of mutations in the motor domain sub-domains. For this analysis, the 50/20 loop was included in the actin-myosin interface sub-domain. (B) Comparison between mutations present in the motor domains functional sub-domains (F) and the outer structural region (S). * indicates that the observed number of mutations is significantly different than expected (p < 0.01). (C) Motor domain distribution of mutations causing dilated cardiomyopathy. Motor domain minus A-M/C corresponds to the motor domain minus the actin-myosin interface and converter regions. * indicates that the observed number of mutations is significantly different than expected (p < 0.01).
Figure 3
Figure 3
Analysis of mutations located in the heptad repeats of the rod. Black columns correspond to the total number of observed mutations (similar plus dissimilar), dotted and striped columns correspond to the number of similar and dissimilar observed mutations respectively. White columns and dotted lines correspond to the theoretical number of expected mutations. d, e, f, g, a, b, c indicate the heptad repeat positions. Distribution of total (A), similar (B) and dissimilar (C) mutations in each position of the heptad repeat. Comparison of total (D), similar (E) and dissimilar (F) mutations in the internal d and a positions and the exposed e, f, g, b, c positions.
Figure 4
Figure 4
Analysis of observed mutations located in single repeats of the rod. (A) Distribution of total mutations in the each of the 38 repeats of the rod. The x-axis corresponds to repeat number; the y-axis corresponds to the number of mutations. The boundaries between the rod-hinge, the hinge and the LMM domains are shown at the top of the graph. p < 0.01 indicates that the distribution is statistical different from the random expectation. (B) Distribution of dissimilar observed mutations represented as striped columns in each of the 38 repeats of the rod. The dotted line corresponds to the theoretical number of expected mutations, the x-axis to repeat number, and the y-axis to the number of mutations. p < 0.01 indicates that the observed number of mutations in each repeat is significantly different than expected. (C) Charge profile comparison between repeats of the rod. The degrees of homology are imaged in the heat map according to the following color relationship: red (highest) →yellow →green→ blue (lowest).
Figure 5
Figure 5
Analysis of mutations located in the rod-hinge, hinge and LMM domains. Black columns correspond to the total number of observed mutations (similar plus dissimilar), dotted and striped columns correspond to the number of similar and dissimilar observed mutations respectively. White columns correspond to the theoretical number of expected mutations. * indicates that the number of observed mutations is significantly different than expected (p < 0.01).
Figure 6
Figure 6
Analysis of mutations located in the heptad repeats of the rod-hinge, hinge, and LMM domains. Black columns correspond to the total number of observed mutations (similar plus dissimilar), dotted and striped columns correspond to the number of similar and dissimilar observed mutations respectively. White columns and the dotted line correspond to the theoretical number of expected mutations. d, e, f, g, a, b, c indicate the heptad repeat positions. Distribution of total, similar and dissimilar mutations in each position of the heptad repeat in the rod-hinge (A left), hinge (B left), and LMM (C left). Distribution of total, similar, and dissimilar mutations in the internal d and a positions and the exposed e, f, g, b, c positions in the rod-hinge (A right), hinge (B right), and LMM (C right).
Figure 7
Figure 7
Comparison of rod-hinge, hinge, and LMM mutations located in each position of the heptad repeats (A), and in the internal d and a positions and the exposed e, f, g, b, c positions (B). Black columns correspond to the total number of observed mutations (similar plus dissimilar), dotted and striped columns correspond to the number of similar and dissimilar observed mutations respectively. White columns correspond to the theoretical number of expected mutations. Circled d, e, f, g, a, b, c indicate the heptad repeat positions.* indicates that the observed number of mutations is significantly different than expected (p < 0.01, except for the a position with p < 0.05).
Figure 7
Figure 7
Comparison of rod-hinge, hinge, and LMM mutations located in each position of the heptad repeats (A), and in the internal d and a positions and the exposed e, f, g, b, c positions (B). Black columns correspond to the total number of observed mutations (similar plus dissimilar), dotted and striped columns correspond to the number of similar and dissimilar observed mutations respectively. White columns correspond to the theoretical number of expected mutations. Circled d, e, f, g, a, b, c indicate the heptad repeat positions.* indicates that the observed number of mutations is significantly different than expected (p < 0.01, except for the a position with p < 0.05).
Figure 8
Figure 8
Distribution of mutations causing distal skeletal myopathies. The black columns correspond to the total number of observed mutations (similar plus dissimilar). White columns correspond to the theoretical number of expected mutations. * indicates that the number of observed mutations is significantly different than expected (p < 0.05).
Figure 9
Figure 9
Amino acid charge transition analysis. Black columns correspond to the number of observed charge transitions; white columns correspond to the theoretical number of expected charge transitions. Entire myosin molecule (A), motor domain (B) and rod (C). p < 0.01 indicates that all numbers of transitions observed are significantly different than expected.
Figure 10
Figure 10
Amino acid charge transition analysis. Black columns correspond to the number of observe transitions; white columns correspond to the theoretical number of expected charge transitions. rod-hinge (A), hinge (B) and LMM (C). p < 0.01 indicates that all numbers of transitions observed are significantly different than expected.

References

    1. Andersen PS, Havndrup O, Bundgaard H, et al. Myosin light chain mutations in familial hypertrophic cardiomyopathy: phenotypic presentation and frequency in Danish and South African populations. J Med Genet. 2001;38:E43. - PMC - PubMed
    1. Arad M, Penas-Lado M, Monserrat L, et al. Gene mutations in apical hypertrophic cardiomyopathy. Circulation. 2005;112:2805–2811. - PubMed
    1. Blair E, Redwood C, de Jesus Oliveira M, et al. Mutations of the light meromyosin domain of the beta-myosin heavy chain rod in hypertrophic cardiomyopathy. Circ Res. 2002;90:263–269. - PubMed
    1. Blankenfeldt W, Thoma NH, Wray JS, Gautel M, Schlichting I. Crystal structures of human cardiac beta-myosin II S2-Delta provide insight into the functional role of the S2 subfragment. Proc Natl Acad Sci U S A. 2006;103:17713–17717. - PMC - PubMed
    1. Bohlega S, Abu-Amero SN, Wakil SM, et al. Mutation of the slow myosin heavy chain rod domain underlies hyaline body myopathy. Neurology. 2004;62:1518–1521. - PubMed

Publication types