. 2008 Aug 15;42(2):503-14.
doi: 10.1016/j.neuroimage.2008.04.254. Epub 2008 May 7.

Longitudinal changes in patients with traumatic brain injury assessed with diffusion-tensor and volumetric imaging

Affiliations

Longitudinal changes in patients with traumatic brain injury assessed with diffusion-tensor and volumetric imaging

Barbara B Bendlin et al. Neuroimage. .

Abstract

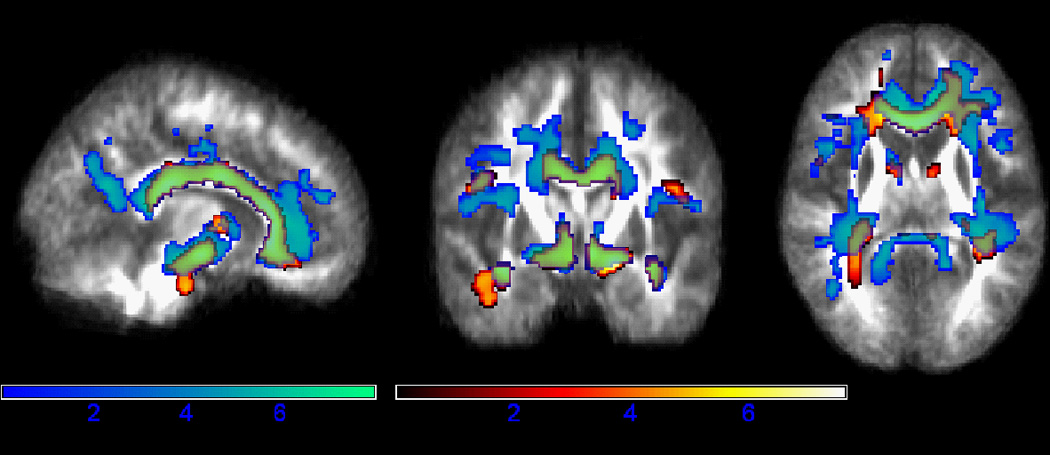
Traumatic brain injury (TBI) is associated with brain volume loss, but there is little information on the regional gray matter (GM) and white matter (WM) changes that contribute to overall loss. Since axonal injury is a common occurrence in TBI, imaging methods that are sensitive to WM damage such as diffusion-tensor imaging (DTI) may be useful for characterizing microstructural brain injury contributing to regional WM loss in TBI. High-resolution T1-weighted imaging and DTI were used to evaluate regional changes in TBI patients compared to matched controls. Patients received neuropsychological testing and were imaged approximately 2 months and 12.7 months post-injury. Paradoxically, neuropsychological function improved from Visit 1 to Visit 2, while voxel-based analyses of fractional anisotropy (FA), and mean diffusivity (MD) from the DTI images, and voxel-based analyses of the GM and WM probability maps from the T1-weighted images, mainly revealed significantly greater deleterious GM and WM change over time in patients compared to controls. Cross-sectional comparisons of the DTI measures indicated that patients have decreased FA and increased MD compared to controls over large regions of the brain. TBI affected virtually all of the major fiber bundles in the brain including the corpus callosum, cingulum, the superior and inferior longitudinal fascicules, the uncinate fasciculus, and brain stem fiber tracts. The results indicate that both GM and WM degeneration are significant contributors to brain volume loss in the months following brain injury, and also suggest that DTI measures may be more useful than high-resolution anatomical images in assessment of group differences.


Figures

Figure 1
Figure 1
Fractional Anisotropy and White Matter MD: Cross-sectional Comparison. The TBI group had lower FA and higher MD compared to controls in several major white matter tracts. Regions of lower FA are shown in hot colors and regions of higher MD are shown in winter colors. Areas where the TBI group differed from controls on both MD and FA measures (primarily in the corpus callosum and cerebral peduncles) appear green. Results are shown in neurological orientation (left is left). Color bars reflect t-statistics.
Figure 2
Figure 2
T1-derived Gray Matter and White Matter volume: Cross-sectional Comparison. TBI patients showed decreased GM volume compared to controls in the insula, thalamus, caudate, vermis, and small portions of right medial frontal gray matter, shown in hot colors. Patients showed one small anterior region of lower WM volume, shown in winter colors. Results are shown in neurological orientation (left is left). Color bars reflect t-statistics.
Figure 3
Figure 3
Fractional Anisotropy and White Matter MD: Longitudinal Interaction between VISIT and GROUP. TBI patients showed a greater decline in FA (winter colors) and a greater increase in MD (hot colors) over time, compared to controls. FA changes were more localized, while white matter MD changes were more diffuse and extended beyond the major white matter tracts, encompassing short association fibers in frontal, temporal, parietal, and occipital white matter. Results are shown in neurological orientation (left is left). Color bars reflect t-statistics.
Figure 4
Figure 4
Gray Matter and White Matter Volume: Longitudinal Interaction between VISIT and GROUP. The TBI group showed extensive white matter volume decline over time (shown in hot colors), in addition to a few regions of GM volume decline, including the thalamus and bilateral pallidum (shown in winter colors). Patients also showed gray matter volume decline over time in the cingulum, right post central gyrus, supplementary motor area, right precentral gyrus, and bilateral putamen (areas not shown here). Results are shown in neurological orientation (left is left). Color bars reflect t-statistics.
Figure 5
Figure 5
White Matter Longitudinal Interaction between VISIT and GROUP. TBI patients showed lower white matter volume in the splenium of the corpus callosum at Visit 1, compared to controls. While controls did not change from Visit 1 to Visit 2, TBI patients declined over the one year interval. The plot on the right was generated from WM volume values extracted from the region indicated by the red arrow on the glass brain (left).
Figure 6
Figure 6
Negative relationship between Mean Diffusivity and Memory in posterior cingulate. Both TBI patients and controls showed a negative relationship between MD in the dorsal posterior cingulate and memory. MD data were extracted from the maxima of a significant cluster in dorsal posterior cingulate and plotted against the memory principal component score, which was based on 4 scores of memory function. Although there was no significant slope difference between TBI and controls, fit lines are shown by group for illustrative purposes. Controls are shown in blue and TBI are shown in red. Interestingly, the scatter indicates that the TBI group had lower MD than the controls in this region, but the cross-sectional voxel-wise comparison of TBI and controls did not show any regions where MD was significantly lower in controls.
Figure 7
Figure 7
Interaction between Mean Diffusivity and Executive function in parahippocampus. Although we had hypothesized that TBI patients would show a stronger relationship between the cognitive measures and measures of diffusion, controls actually showed the stronger relationship. Shown here is a plot of mean diffusivity values against the executive principal component score which was based on 3 scores of executive function. Controls are shown in blue and TBI patients are plotted in red.

References

    1. Anderson CV, Bigler ED, Blatter DD. Frontal lobe lesions, diffuse damage, and neuropsychological functioning in traumatic brain-injured patients. J Clin Exp Neuropsychol. 1995;17:900–908. - PubMed
    1. Arfanakis K, Haughton VM, Carew JD, Rogers BP, Dempsey RJ, Meyerand ME. Diffusion tensor MR imaging in diffuse axonal injury. AJNR Am J Neuroradiol. 2002;23:794–802. - PMC - PubMed
    1. Ariza M, Junque C, Mataro M, Poca MA, Bargallo N, Olondo M, Sahuquillo J. Neuropsychological correlates of basal ganglia and medial temporal lobe NAA/Cho reductions in traumatic brain injury. Arch Neurol. 2004;61:541–544. - PubMed
    1. Ariza M, Serra-Grabulosa JM, Junque C, Ramirez B, Mataro M, Poca A, Bargallo N, Sahuquillo J. Hippocampal head atrophy after traumatic brain injury. Neuropsychologia. 2006;44:1956–1961. - PubMed
    1. Bergeson AG, Lundin R, Parkinson RB, Tate DF, Victoroff J, Hopkins RO, Bigler ED. Clinical rating of cortical atrophy and cognitive correlates following traumatic brain injury. Clin Neuropsychol. 2004;18:509–520. - PubMed

Publication types