. 2008 Jul 3;103(1):107-16.
doi: 10.1161/CIRCRESAHA.108.178525. Epub 2008 Jun 12.

Local activation or implantation of cardiac progenitor cells rescues scarred infarcted myocardium improving cardiac function

Affiliations

Local activation or implantation of cardiac progenitor cells rescues scarred infarcted myocardium improving cardiac function

Marcello Rota et al. Circ Res. .

Abstract

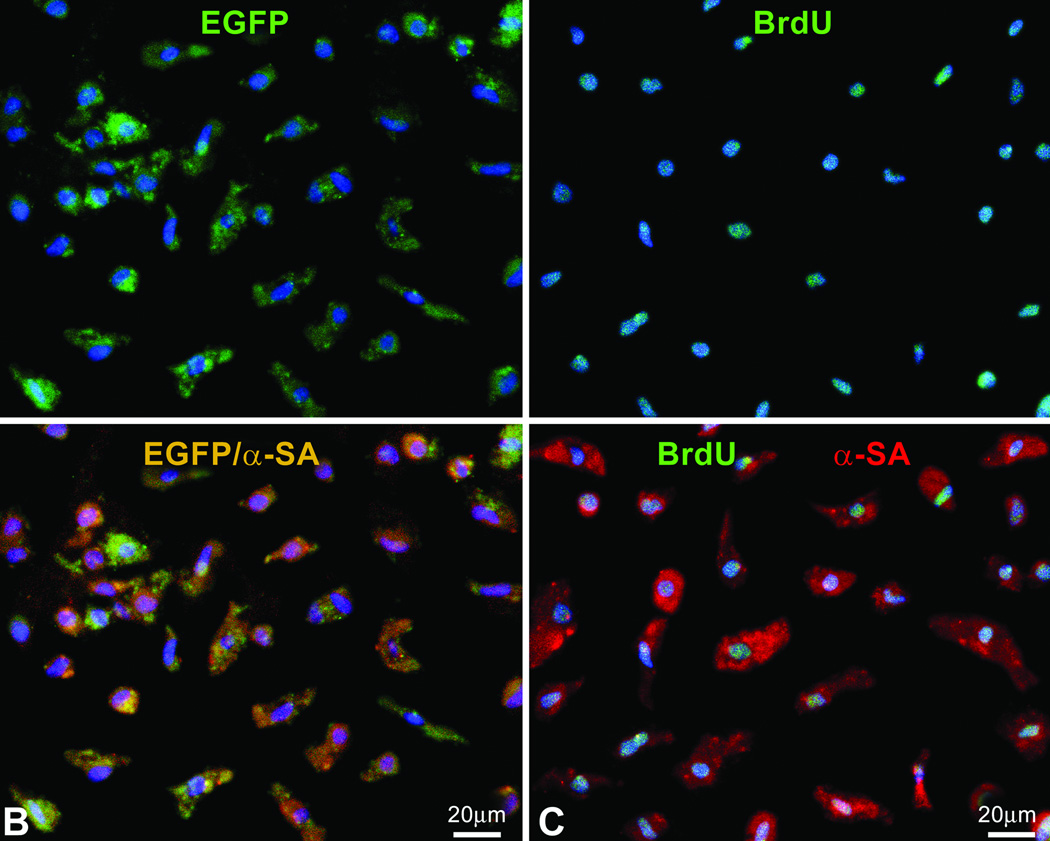
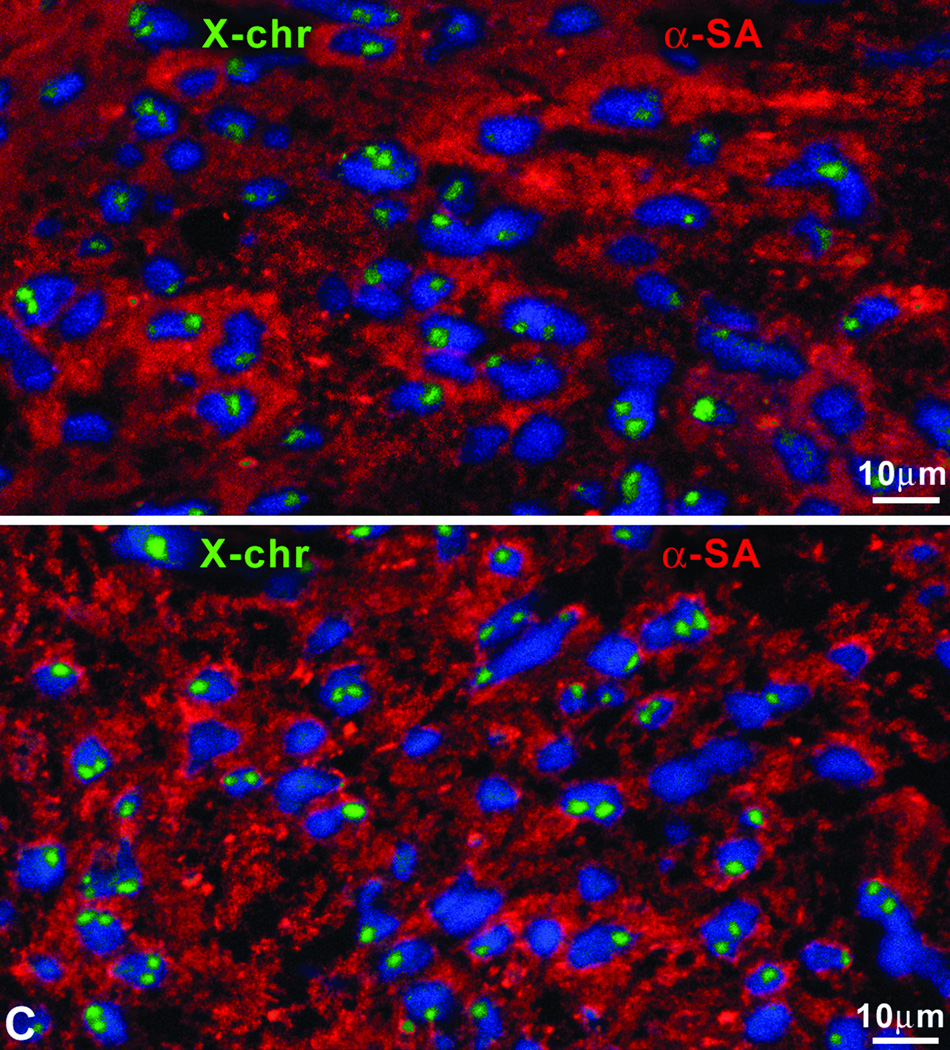
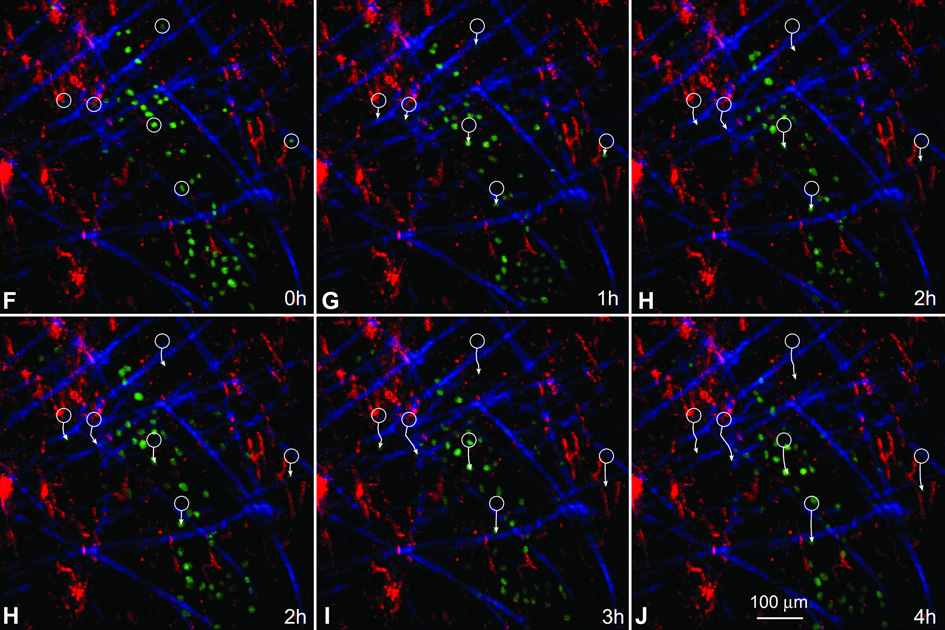
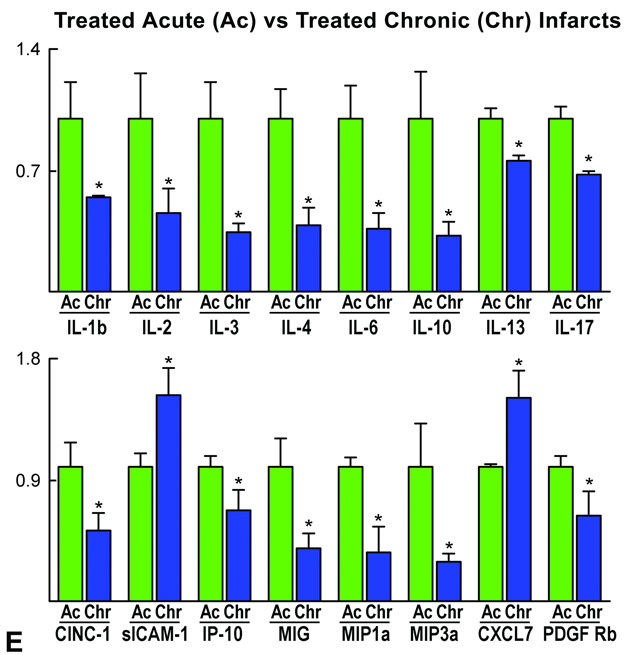
Ischemic heart disease is characterized chronically by a healed infarct, foci of myocardial scarring, cavitary dilation, and impaired ventricular performance. These alterations can only be reversed by replacement of scarred tissue with functionally competent myocardium. We tested whether cardiac progenitor cells (CPCs) implanted in proximity of healed infarcts or resident CPCs stimulated locally by hepatocyte growth factor and insulin-like growth factor-1 invade the scarred myocardium and generate myocytes and coronary vessels improving the hemodynamics of the infarcted heart. Hepatocyte growth factor is a powerful chemoattractant of CPCs, and insulin-like growth factor-1 promotes their proliferation and survival. Injection of CPCs or growth factors led to the replacement of approximately 42% of the scar with newly formed myocardium, attenuated ventricular dilation and prevented the chronic decline in function of the infarcted heart. Cardiac repair was mediated by the ability of CPCs to synthesize matrix metalloproteinases that degraded collagen proteins, forming tunnels within the fibrotic tissue during their migration across the scarred myocardium. New myocytes had a 2n karyotype and possessed 2 sex chromosomes, excluding cell fusion. Clinically, CPCs represent an ideal candidate cell for cardiac repair in patients with chronic heart failure. CPCs may be isolated from myocardial biopsies and, following their expansion in vitro, administered back to the same patients avoiding the adverse effects associated with the use of nonautologous cells. Alternatively, growth factors may be delivered locally to stimulate resident CPCs and promote myocardial regeneration. These forms of treatments could be repeated over time to reduce progressively tissue scarring and expand the working myocardium.


Figures

Figure 1
Figure 1
Myocardial regeneration. A: Healed myocardial infarct (collagen accumulation, blue). A thin layer of spared myocytes is present in the subendocardium. B and C: Band of regenerated myocytes within the infarct (MHC: myosin-heavy-chain, red; arrowheads) following GF-activation of resident CPCs (B) or treatment with EGFP-positive-CPCs (C: EGFP, green). The areas included in the rectangles are shown at higher magnification in the adjacent panels.
Figure 2
Figure 2
Cardiac anatomy and function. A: Myocardial regeneration attenuates cavitary dilation. SO: sham-operated; MI: infarcted-untreated; MI-T: infarcted-treated. *P<0.05 vs SO. †P<0.05 vs MI. B: EF decreased in infarcted animals at 18 days; in untreated-infarcts EF decreased further from 18 to 34 days. Conversely, EF increased from 18 to 34 days in infarcts treated with CPCs or GFs. C: Ventricular function. For symbols, see A.
Figure 2
Figure 2
Cardiac anatomy and function. A: Myocardial regeneration attenuates cavitary dilation. SO: sham-operated; MI: infarcted-untreated; MI-T: infarcted-treated. *P<0.05 vs SO. †P<0.05 vs MI. B: EF decreased in infarcted animals at 18 days; in untreated-infarcts EF decreased further from 18 to 34 days. Conversely, EF increased from 18 to 34 days in infarcts treated with CPCs or GFs. C: Ventricular function. For symbols, see A.
Figure 3
Figure 3
Regenerated myocytes. A: Scatter plot of cells isolated from the scarred region of untreated, CPC-treated and GF-treated infarcts. Newly formed myocytes express EGFP and α-sarcomeric-actin (α-SA) or BrdU and α-SA. The values of these cell populations are listed. B and C: Sorted regenerated myocytes are positive for EGFP and α-SA (B), and BrdU and α-SA (C). D: Border zone between surviving (SM) and regenerated (RM) myocardium in an infarcted-heart treated with CPCs. The area included in the rectangle is shown at higher magnification in the lower panel. Connexin 43 (white, arrowheads) is present between EGFP-positive regenerated myocytes and EGFP-negative pre-existing myocytes. E: Ki67- and BrdU-labeled regenerated myocytes.
Figure 3
Figure 3
Regenerated myocytes. A: Scatter plot of cells isolated from the scarred region of untreated, CPC-treated and GF-treated infarcts. Newly formed myocytes express EGFP and α-sarcomeric-actin (α-SA) or BrdU and α-SA. The values of these cell populations are listed. B and C: Sorted regenerated myocytes are positive for EGFP and α-SA (B), and BrdU and α-SA (C). D: Border zone between surviving (SM) and regenerated (RM) myocardium in an infarcted-heart treated with CPCs. The area included in the rectangle is shown at higher magnification in the lower panel. Connexin 43 (white, arrowheads) is present between EGFP-positive regenerated myocytes and EGFP-negative pre-existing myocytes. E: Ki67- and BrdU-labeled regenerated myocytes.
Figure 4
Figure 4
Properties of regenerated myocytes. A: Regenerated (left panels) and surviving (right panels) myocytes. Green: native EGFP fluorescence. Representative tracings of EGFP-positive and EGFP-negative myocytes, volume of myocytes measured physiologically and myocyte fractional shortening. B: DNA content of regenerated and spared myocytes. Shaded bars correspond to cycling Ki67-positive myocytes. C: Nuclei of newly formed myocytes exhibit at most two X chromosomes (green).
Figure 4
Figure 4
Properties of regenerated myocytes. A: Regenerated (left panels) and surviving (right panels) myocytes. Green: native EGFP fluorescence. Representative tracings of EGFP-positive and EGFP-negative myocytes, volume of myocytes measured physiologically and myocyte fractional shortening. B: DNA content of regenerated and spared myocytes. Shaded bars correspond to cycling Ki67-positive myocytes. C: Nuclei of newly formed myocytes exhibit at most two X chromosomes (green).
Figure 5
Figure 5
Characteristics of the surviving myocardium. Myocyte volume, arteriole and capillary density, and proliferation of myocytes and endothelial cells (ECs). SO: sham-operated; MI: infarcted-untreated; MI-T: infarcted-treated. *P<0.05 vs SO.
Figure 6
Figure 6
Migration of CPCs. A–E: Translocation of EGFP-positive-CPCs at 24 hours after cell implantation in a chronic infarct. The same field, examined at one-hour intervals is illustrated. Green: EGFP-positive-cells; red: coronary vasculature perfused with rhodamine-labeled-dextran. Blue: collagen. White circles in A indicate the position of selected cells at the beginning of observation. White arrows reflect the direction of migration and the distance covered by the cells in 1–4 hours. FJ: Translocation of EGFP-positive-CPCs at 24 hours after cell implantation in an acute infarct. The movement of cells is illustrated as described above.
Figure 6
Figure 6
Migration of CPCs. A–E: Translocation of EGFP-positive-CPCs at 24 hours after cell implantation in a chronic infarct. The same field, examined at one-hour intervals is illustrated. Green: EGFP-positive-cells; red: coronary vasculature perfused with rhodamine-labeled-dextran. Blue: collagen. White circles in A indicate the position of selected cells at the beginning of observation. White arrows reflect the direction of migration and the distance covered by the cells in 1–4 hours. FJ: Translocation of EGFP-positive-CPCs at 24 hours after cell implantation in an acute infarct. The movement of cells is illustrated as described above.
Figure 7
Figure 7
Expression and activity of MMPs and TIMP-4. A: Expression of MMP-2, MMP-9, MMP-14 and TIMP-4 in treated (T) and untreated (C) infarcts at 1, 2 and 3 days (d).B: Activity of MMP-9 and MMP-2. Gelatinase-activity appears as clear bands against a blue background. C: OD. *P<0.05 vs untreated control.
Figure 7
Figure 7
Expression and activity of MMPs and TIMP-4. A: Expression of MMP-2, MMP-9, MMP-14 and TIMP-4 in treated (T) and untreated (C) infarcts at 1, 2 and 3 days (d).B: Activity of MMP-9 and MMP-2. Gelatinase-activity appears as clear bands against a blue background. C: OD. *P<0.05 vs untreated control.
Figure 8
Figure 8
Cytokine and growth factor array. The content of cytokines and growth factors was analyzed in myocardial tissue samples. Only differences in expression that were statistically significant are shown. For a complete list of cytokines and growth factors, see Supplemental Table I. A–E: Fold changes in protein quantities. Data are mean±SD; *P<0.05. sICAM-1, soluble intercellular adhesion molecule-1; CXCL7, CXC chemokine ligand 7; bFGF, basic fibroblast growth factor; TIMP-1, tissue inhibitor of MMPs-1; IL, interleukin; CINC, cytokine induced-neutrophil-chemoattractant; TNF-α, tumor necrosis factor α; LIX, LPS-induced CXC chemokine; MIP, macrophage inflammatory protein; IP-10, interferon-γ-inducible protein 10; PDGF-R, platelet-derived growth factor-receptor; AR, amphiregulin; G-CSF, granulocyte-colony stimulating factor; IL-1Ra, interleukin-1 receptor antagonist; TGF-β, transforming growth factor-β; MIG, migration-inducing protein.
Figure 8
Figure 8
Cytokine and growth factor array. The content of cytokines and growth factors was analyzed in myocardial tissue samples. Only differences in expression that were statistically significant are shown. For a complete list of cytokines and growth factors, see Supplemental Table I. A–E: Fold changes in protein quantities. Data are mean±SD; *P<0.05. sICAM-1, soluble intercellular adhesion molecule-1; CXCL7, CXC chemokine ligand 7; bFGF, basic fibroblast growth factor; TIMP-1, tissue inhibitor of MMPs-1; IL, interleukin; CINC, cytokine induced-neutrophil-chemoattractant; TNF-α, tumor necrosis factor α; LIX, LPS-induced CXC chemokine; MIP, macrophage inflammatory protein; IP-10, interferon-γ-inducible protein 10; PDGF-R, platelet-derived growth factor-receptor; AR, amphiregulin; G-CSF, granulocyte-colony stimulating factor; IL-1Ra, interleukin-1 receptor antagonist; TGF-β, transforming growth factor-β; MIG, migration-inducing protein.

References

    1. Leri A, Kajstura J, Anversa P. Cardiac stem cells and mechanisms of myocardial regeneration. Physiol Rev. 2005;85:1373–1416. - PubMed
    1. Urbanek K, Torella D, Sheikh F, De Angelis A, Nurzynska D, Silvestri F, Beltrami CA, Bussani R, Beltrami AP, Quaini F, Bolli R, Leri A, Kajstura J, Anversa P. Myocardial regeneration by activation of multipotent cardiac stem cells in ischemic heart failure. Proc Natl Acad Sci USA. 2005;102:8692–8697. - PMC - PubMed
    1. Beltrami AP, Urbanek K, Kajstura J, Yan SM, Finato N, Bussani R, Nadal-Ginard B, Silvestri F, Leri A, Beltrami CA, Anversa P. Evidence that human cardiac myocytes divide after myocardial infarction. New Engl J Med. 2001;334:1750–1757. - PubMed
    1. Kajstura J, Leri A, Finato N, Di Loreto C, Beltrami CA, Anversa P. Myocyte proliferation in end-stage cardiac failure in humans. Proc Natl Acad Sci USA. 1998;95:8801–8805. - PMC - PubMed
    1. Beltrami AP, Barlucchi L, Torella D, Baker M, Chimenti S, Kasahara H, Rota M, Musso E, Urbanek K, Leri A, Kajstura J, Nadal-Ginard B, Anversa P. Adult cardiac stem cells are multipotent and support myocardial regeneration. Cell. 2003;114:763–766. - PubMed

Publication types

MeSH terms