

Comparative Study
doi: 10.2105/AJPH.2007.123778.
Epub 2008 Jun 12.
Preliminary evidence for an emerging nonmetropolitan mortality penalty in the United States
Affiliations
- PMID: 18556611
- PMCID: PMC2446448
- DOI: 10.2105/AJPH.2007.123778
Item in Clipboard
Comparative Study
Preliminary evidence for an emerging nonmetropolitan mortality penalty in the United States
Am J Public Health.
2008 Aug.
Abstract
We discovered an emerging non-metropolitan mortality penalty by contrasting 37 years of age-adjusted mortality rates for metropolitan versus nonmetropolitan US counties. During the 1980s, annual metropolitan-nonmetropolitan differences averaged 6.2 excess deaths per 100,000 nonmetropolitan population, or approximately 3600 excess deaths; however, by 2000 to 2004, the difference had increased more than 10 times to average 71.7 excess deaths, or approximately 35,000 excess deaths. We recommend that research be undertaken to evaluate and utilize our preliminary findings of an emerging US nonmetropolitan mortality penalty.
Figures
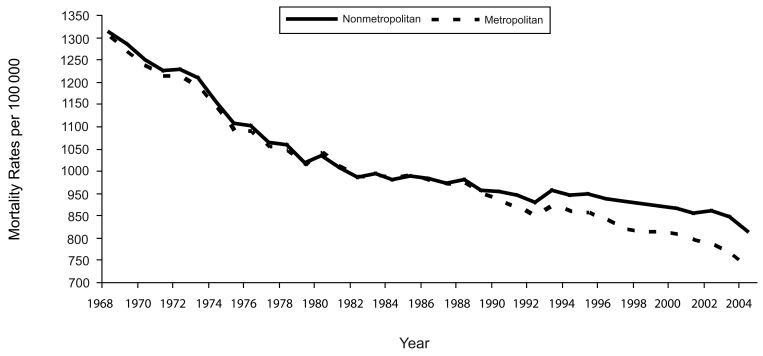
Annual metropolitan and nonmetropolitan age-adjusted mortality per 100 000: United States, 1968–2004. Note. The Rural–Urban Continuum codes were used to classify metropolitan and nonmetropolitan counties; 1974 codes were used for 1968 to 1975, 1983 codes were used for 1976 to 1985, 1993 codes were used for 1986 to 1995, and the 2003 codes were used for 1996 to 2004. Data were derived from the National Center for Health Statistics Compressed Mortality File numbers 2A, 2E, and 2J.–
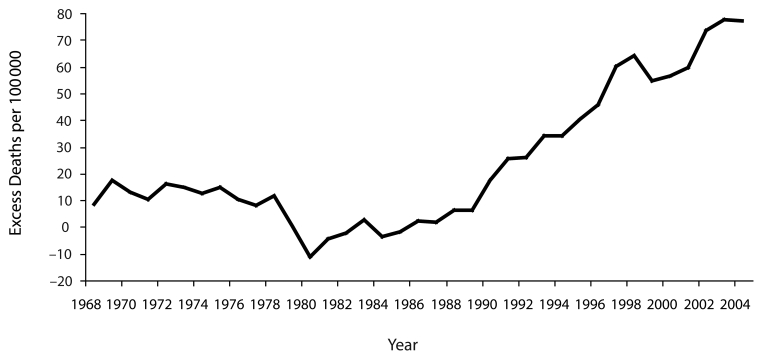
The magnitude of nonmetropolitan mortality disparities expressed in excess deaths per 100 000: United States, 1968–2004. Note. The nonmetropolitan mortality disparities were calculated as nonmetropolitan age-adjusted mortality per 100 000 minus metropolitan age-adjusted mortality per 100 000. Data were derived from the National Center for Health Statistics Compressed Mortality File numbers 2A, 2E, and 2J.–
References
-
- Haines MR. The urban mortality transition in the United States, 1800–1940. Ann Demogr Hist (Paris). 2001;101:33–64.
-
- Ricketts TC III. Rural Health in the United States. New York, NY: Oxford University Press; 1999.
-
- Eberhardt MS, Ingram DD, Makuc DM, et al. Health, United States, 2001 with Urban and Rural Health Chartbook. Hyattsville, MD: National Center for Health Statistics; 2001. PHS 2001–1232.
-
- Gamm LD, Hutchison LL, Dabney BJ, Dorsey AM. Rural Healthy People 2010: A Companion Document to Healthy People 2010. Vol. 1. College Station, TX: School of Rural Public Health, Texas A&M University System Health Science Center; 2003. Available at http://sp.srph.tamhsc.edu/centers/Moved_rhp2010/Volume1.pdf. Accessed July 17, 2007.
-
- Healthy People 2010: Understanding and Improving Health. 2nd ed. Washington, DC: US Dept of Health and Human Services; 2000. Available at http://www.healthypeople.gov/Document/tableofcontents.htm# under. Accessed July 17, 2007.
Publication types
MeSH terms
Grants and funding
LinkOut - more resources
Full Text Sources
Medical
