. 2008 Jul;173(1):77-92.
doi: 10.2353/ajpath.2008.070648. Epub 2008 Jun 13.

Egr-1 regulates expression of the glial scar component phosphacan in astrocytes after experimental stroke

Affiliations

Egr-1 regulates expression of the glial scar component phosphacan in astrocytes after experimental stroke

Heike Beck et al. Am J Pathol. 2008 Jul.

Abstract

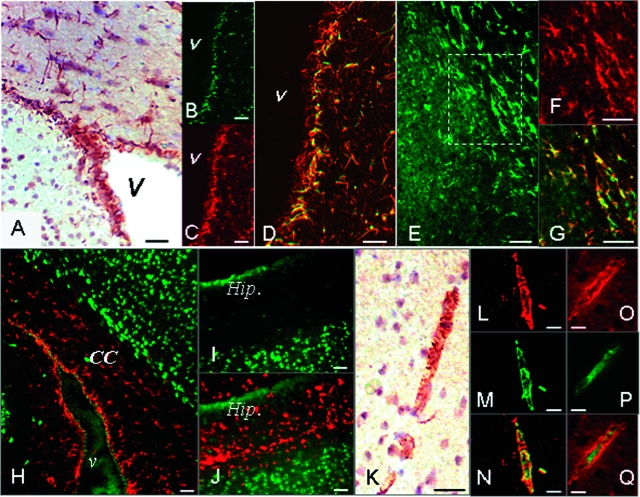
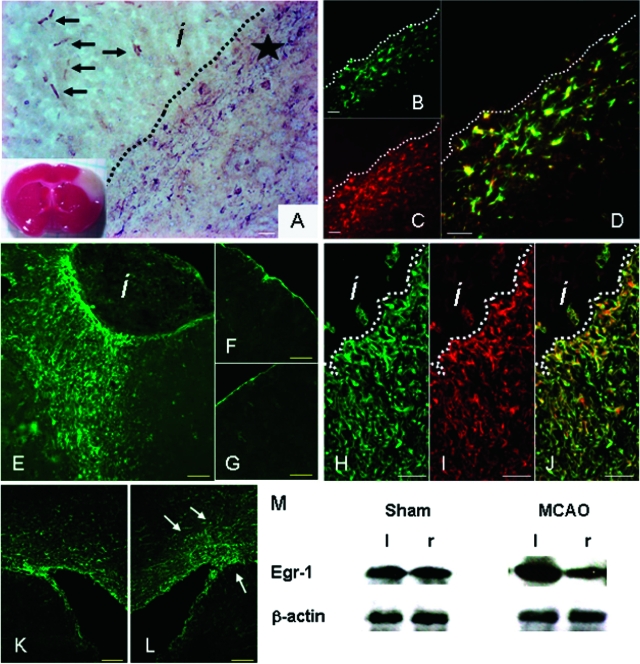
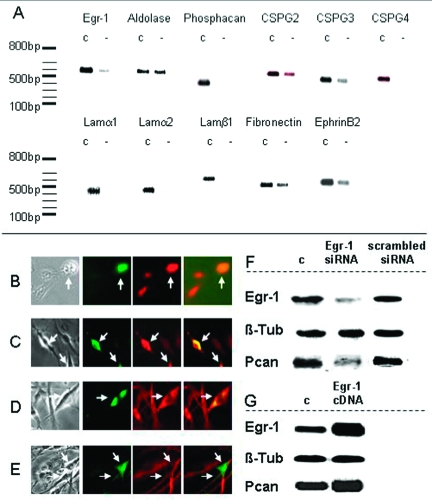
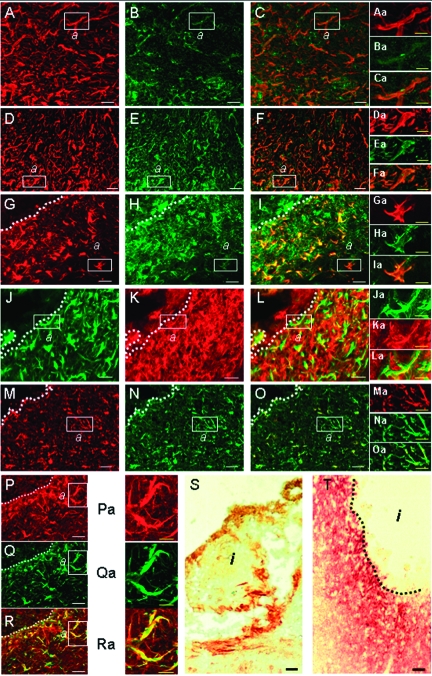
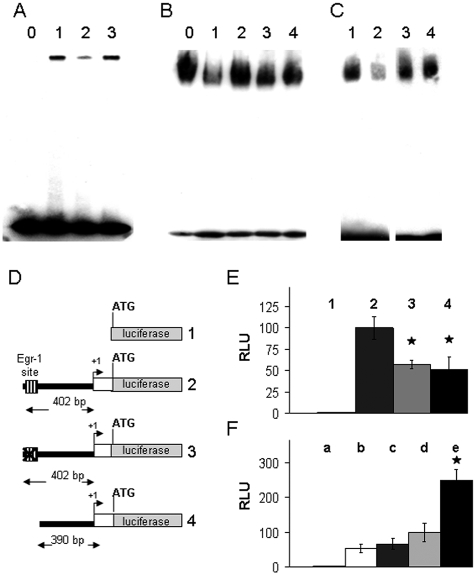
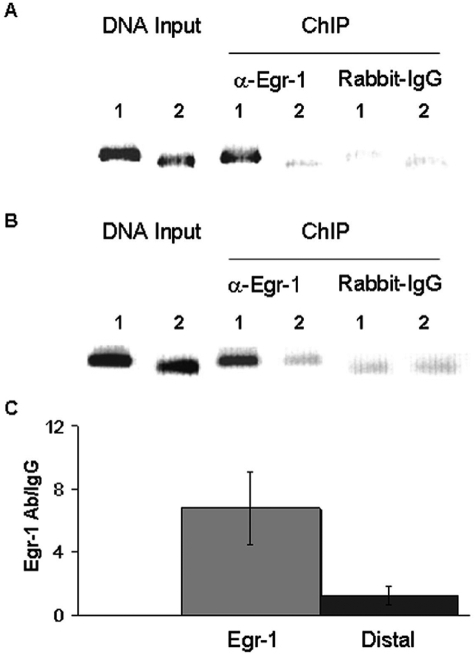
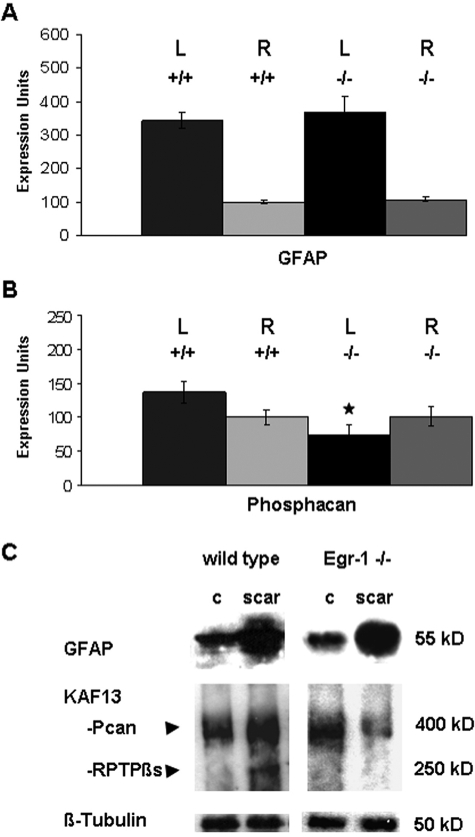
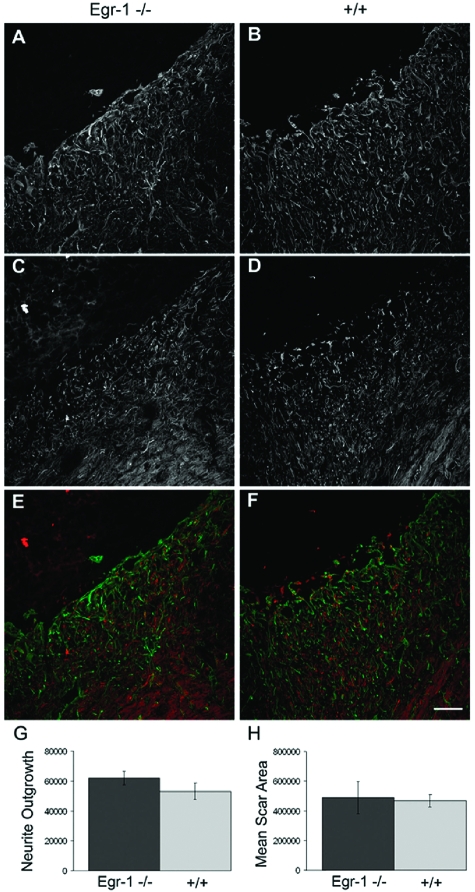
Ischemic brain injury causes tissue damage and neuronal death. The deficits can often be permanent because adult neurons fail to regenerate. One barrier to neuronal regeneration is the formation of the glial scar, a repair mechanism that is otherwise necessary to seal off necrotic areas. The process of gliosis has been well described, but the mechanisms regulating the robust production of scar components after injury remain poorly understood. Here we show that the early growth response 1 transcriptional factor (Egr-1, also called Krox24, Zif268, and NGFI-A) is expressed in astrocytes in the ventricular wall, corpus callosum, and striatum of normal mouse brain. After experimental stroke caused by permanent occlusion of the middle cerebral artery, Egr-1 was expressed long term in reactive astrocytes that accumulate around the injury site. Gain- and loss-of-function studies in primary astrocytes indicated that Egr-1 regulates the transcription of chondroitin sulfate proteoglycans genes, the main extracellular matrix proteins of the glial scar. Egr-1 bound to a site within the phosphacan promoter and transactivated its expression. Egr-1-deficient mice accumulated lower levels of phosphacan RNA and protein than wild-type mice after stroke, but there were no measurable differences in neurite outgrowth toward the infarct area between the two groups. Our findings suggest that Egr-1 is an important component of the transcriptional network regulating genes involved in gliosis after ischemic injury.


Figures

Figure 1
Figure 1
Egr-1 expression in the adult mouse brain. A: Immunohistochemistry using anti-Egr-1 antibody marks cells within and around the brain ventricles. B–D: Immunofluorescence analysis of brain tissue sections stained with anti-Egr-1 and GFAP antibodies. Egr-1-expressing cells next to the ventricles (B, green color) stain positive for the astrocytic marker GFAP (C, red color). Double-labeled cells in D appear in yellow/orange color. E–G: Egr-1-positive cells found in the corpus callosum (E, green color) also stain positive for GFAP (F, red color). Double-labeled astrocytes (G) appear in yellow/orange. Images in F and G represent a higher magnification of the boxed area in E. H–J: Neurons in corpus callosum (H) and hippocampus (I, J) marked by anti-NeuN antibody (in green) express low, or no Egr-1 (in red). K–Q: Immunohistochemistry analysis shows that a subset of vascular structures in the brain stain positive with anti-Egr-1 antibody (K). Egr-1-expressing cells in the vascular wall (L and O, red) stain positive with anti-smooth muscle actin antibody (M, green color). Double-labeled cells (N) appear in yellow/orange. Endothelial cells stained with anti-CD31 antibody (P, green) show less Egr-1 expression in the superimposed images (Q). v, ventricle; CC, corpus callosum; Hip., hippocampus. Scale bars = 25 μm.
Figure 2
Figure 2
Egr-1 expression in adult mouse brain after cerebral ischemia. A: Cerebral ischemia was induced by permanent occlusion of the MCA. The infarcted tissue appears white in the TTC-stained brain slice (inset). Immunohistochemistry using anti-Egr-1 antibody 4 days after MCAO detects Egr-1 expression in cells within the infarct area (arrows) and around the infarct border zone (star). B–D: Immunofluorescence analysis of brain tissue sections stained with anti-Egr-1 and GFAP antibodies 4 days after MCAO. Egr-1-expressing cells in the border zone (B, green color) stain positive for GFAP (C, red color). D: Double-labeled astrocytic cells appear yellow/orange in the superimposed images. E–G: High Egr-1 expression persists in cells around the injury site 6 weeks after infarction. Low-magnification images reveal strong Egr-1 expression (green) in cells accumulating around the infarct region (E) compared with the corresponding area of the contralateral hemisphere (F), or the ipsilateral area of sham-operated animals (G). H–J: Confocal microscopy images of brain tissue sections stained with anti-Egr-1 and GFAP antibodies 6 weeks after MCAO. Egr-1-positive cells (H, green) around and within the glial scar stain positive for GFAP (I, red). Double-labeled astrocytes appear yellow/orange (J). K and L: Confocal microscopy images of brain tissue sections stained with anti-Egr-1 antibody. K: The number of Egr-1-positive cells (in green) around the ventricles of infarcted hemispheres increases after MCAO (L, arrows) compared with contralateral controls. M: Western blotting detects higher levels of Egr-1 protein in scar tissue isolated from infarcted (left, l) hemisphere as compared with corresponding noninfarcted area of the contralateral side (right, r). β-Actin protein levels serve as control. Sham-operated animals have comparable Egr-1 amounts on both brain sides. Quantitative image analysis shows that Egr-1 protein levels are 2.3-fold higher in the peri-infarct region compared with control tissue (SD, 0.3), whereas sham-operated animals show equivalent amounts of Egr-1 protein in the corresponding areas of both hemispheres (0.98-fold difference; SD, 0.12). i: infarct; dotted lines demarcate infarct and peri-infarct areas. Scale bars: 100 μm (A, E–G, K, L); 25 μm (B–D, H–J).
Figure 3
Figure 3
Egr-1 regulates genes involved in gliosis. A: Egr-1 loss-of-function effects on human astrocytes transfected with siRNAs against Egr-1. RT-PCR analysis shows that knockdown of Egr-1 leads to reduction in the expression levels of genes encoding ECM components of the glial scar. c, control mock-transfected cells; −, Egr-1 knockdown. DNA size markers are shown on the left. Gene name abbreviations are as follows: CSPG2, 3, 4, chondroitin sulfate proteoglycan 2, 3, 4, respectively; Lamα1, laminin α1; Lamα2: laminin α2; Lamβ1: laminin β1. Real-time PCR quantification of the effects of the Egr-1 knockdown on the expression of putative gene targets shows a 60% drop in phosphacan RNA levels in Egr-1 siRNA-treated astrocytes. Adjusted for aldolase, relative phosphacan expression was 12.96 ± 1.21 U in controls versus 5.05 ± 0.89 U after Egr-1 knockdown (n = 5, P < 0.001). B–E: Immunofluorescence analysis after Egr-1 overexpression in astrocytes transfected with the CMV-Egr-1-IRES-EGFP construct. Transfected, EGFP-positive cells (green, marked by arrows), stain more intensely with antibodies recognizing laminin α1 (B, red) and phosphacan (C, red, anti-RPTPβ) than nontransfected neighboring cells. No difference in expression levels of GFAP (D, red) or β-tubulin (E, red) between Egr-1-overexpressing cells (green, marked by arrows) and nontransfected cells. Superimposed images (far right) confirm that transfected cells express higher levels of putative Egr-1 targets, but similar levels of other proteins. F: Western blotting of proteins isolated from astrocytes transfected with siRNAs against Egr-1 (Egr-1 siRNA), control siRNA (scrambled siRNA), or mock-transfected cells (c). siRNAs against Egr-1 diminish effectively Egr-1 protein levels and lead to down-regulation of phosphacan (Pcan, detected with the KAF13 antibody). β-Tubulin (β-Tub) levels remain unaffected serving as control. Quantification of blot images shows that Egr-1 protein levels are reduced 3.0-fold versus control (mock-transfected cells; SD, 0.4) and 2.8-fold (SD, 0.2) versus scrambled siRNA-transfected cells; phosphacan protein levels are down-regulated 2.18-fold versus control (mock; SD 0.1) and 2.23 times (SD 0.1) versus scrambled siRNA. G: Western blotting of proteins isolated from astrocytes transfected with the CMV-Egr-1-IRES-EGFP (Egr-1 cDNA) construct or the empty vector (c). Egr-1 protein levels increase 2.08-fold (SD, 0.4) leading to 1.42-fold up-regulation of phosphacan (Pcan; SD, 0.14). β-Tubulin (β-Tub) serves as control.
Figure 4
Figure 4
Egr-1 and its putative target genes show similar spatial and temporal expression patterns in vivo after focal cerebral ischemia. A–C: Confocal microscopy images of brain tissue show Egr-1 protein expression (A, red color) in the gliotic tissue 10 days after MCAO. Egr-1-positive cells are also expressing phosphacan (B, in green, antibody KAF13 recognizing both the secreted and membrane-bound splice variants of phosphacan); the double-labeling image reveals expression overlap of Egr-1 and phosphacan (C, yellow). Aa–Ca: Higher magnification of boxed areas marked (a) in A–C shows co-expression of Egr-1 (Aa) and phosphacan (Ba) inside the gliotic tissue; the superimposed images are shown in Ca. D–F: Immunofluorescence analysis indicates that Egr-1-expressing cells in the glial scar (D, red color) also express phosphacan (E, green color, antibody PTP1 recognizing only membrane-bound phosphacan); the double-labeling image is shown in F. Da–Fa: Higher magnification of boxed areas (a) in D–F shows co-expression of Egr-1 (Da) and phosphacan (Ea) inside the gliotic tissue; the superimposed images are shown in Fa. G–I: Immunofluorescence analysis shows expression of Egr-1 (G, red color) and NG2 (H, green color). The corresponding superimposed images (I) show expression overlap (yellow). Ga–Ia: Higher magnification of boxed areas (a) in G–I shows co-expression of Egr-1 (Ga) and NG2 (Ha) inside the gliotic tissue; the superimposed images are shown in Ia. J–L: Expression of GFAP (J, green color) and NG2 (K, red color) and the corresponding superimposed images (L). Ja–La: Higher magnification of boxed areas (a) in J–L shows co-expression of GFAP (Ja) and NG2 (Ka) inside the gliotic tissue; the superimposed images are shown in La. M–O: Immunofluorescence analysis showing expression of GFAP (M, red color) and laminin α1 (N, green color); the corresponding superimposed images are shown in O. Ma–Oa: Higher magnification of boxed areas (a) in M–O shows co-expression of GFAP (Ma) and laminin α1 (Na) inside the gliotic tissue; the superimposed images are shown in Oa. P–R: Confocal microscopy images show that Egr-1-positive cells (P, red color) in the infarct border zone also express laminin α1 (Q, green color); the superimposed images are shown in R. Pa–Ra: Higher magnification of boxed areas (a) in P–R shows co-expression of Egr-1 (Pa) and laminin α1 (Qa); the superimposed images are shown in Ra. S: Immunohistochemistry staining of ephrin B1/B2 (brown color) in mouse brain 6 weeks after MCAO. Ephrin B1/B2 expression predominates in the zone that directly surrounds the infarcted area. T: Immunohistochemistry staining of neurocan (brown/red color) in gliotic rat brain tissue 10 days after MCAO. Dotted lines demarcate the infarct areas (i). Scale bars: 25 μm (A–T); 10 μm (Aa–Ra).
Figure 5
Figure 5
Egr-1 binds and transactivates the human phosphacan promoter. A: EMSAs with biotin-labeled OGNs carrying the putative phosphacan promoter Egr-1 site (Phos-1) were incubated with: 0, no nuclear extract; 1, nuclear extract from astrocytes; 2, nuclear extract from astrocytes plus unlabeled OGN carrying the fibronectin promoter Egr-1 site; and 3, nuclear extract from astrocytes plus the same fibronectin promoter OGN, but with a mutated Egr-1 site. The OGN with the fibronectin promoter Egr-1 site (lane 2) competes effectively with binding to Phos-1. B: EMSA using the Phos-1 OGN and nuclear extracts from astrocytes in the presence of antibodies against different Egr family members. The numbered lanes represent the following conditions: 0, no antibody; 1, anti-Egr-1; 2, anti-Egr-2; 3, anti-Egr-3; and 4, anti-Egr-4. Only the anti-Egr-1 antibody in lane 2 hinders the nuclear protein/Phos-1 DNA binding complex. C: EMSA using Phos-1 and OCT-1 OGN and nuclear extracts isolated from wild-type (WT) or Egr-1-deficient mouse brain tissue. Numbered lanes represent: 1, Phos-1 OGN incubated with nuclear extract from WT brain tissue; 2, Phos-1 OGN incubated with nuclear extract from Egr-1−/− brain tissue; 3,: OCT-1 OGN incubated with nuclear extract from WT brain; and 4, OCT-1 OGN incubated with nuclear extract from Egr-1−/− brain tissue. Nuclear extracts from Egr-1−/− brain tissue (lane 2) produce less Phos-1 shift. D: Schematic drawing of the four constructs used to study the activity of the phosphacan promoter Egr-1 binding site. Construct 1: pGL3 basic, empty vector; construct 2: contains the 402-bp promoter fragment of the phosphacan gene cloned in pGL3; construct 3: same as 2 except point mutations were introduced to destroy the Egr-1 site; and construct 4: same as 2 except for a short nucleotide deletion that removes the Egr-1 site. E: The constructs outlined in D were transfected in primary human astrocytes and cell extracts were assayed for luciferase activity 24 hours later. Bars labeled 1 to 4 represent the activities of constructs 1 to 4, respectively. Mann-Whitney rank sum test shows a statistically significant difference between construct 2 and constructs 3 and 4, P < 0.001. F: Luciferase assay in HeLa cells after transfection of: a, construct 1, empty vector; b, construct 4 lacking the Egr-1 site; c, construct 4 together with the Egr-1 expression vector; d, construct 2 including the Egr-1 site; e, construct 2 together with the Egr-1 expression vector. Mann-Whitney rank sum test shows a statistical significant difference between d and e, P < 0.001. RLU, relative luciferase units. The activity of construct 2 (bars 2 in E and d in F) in one assay was set arbitrarily as 100.
Figure 6
Figure 6
Egr-1 binds to the phosphacan promoter in vivo. A: HeLa cells were transiently transfected with Egr-1 full-length human cDNA and subjected to ChIP with anti-Egr-1 antibody or rabbit IgG isotype control. Specific primers were used to amplify the area containing the putative Egr-1 site (lanes 1), or a distal, 4.5-kb upstream fragment (lanes 2). Genomic DNA input shows that the primers amplify bands of the expected size. Immunoprecipitation of sheared chromatin (ChIP) with anti-Egr-1 (α-Egr-1) produces a band of stronger intensity as compared with the distal site product and to control isotype IgG. B: HeLa cells were stimulated for 2 hours with PMA and ionomycin to induce endogenous Egr-1 and subjected to ChIP with anti-Egr-1 antibody or rabbit IgG isotype control. Precipitated DNA fragments were amplified with the same primers as in A surrounding the Egr-1 site (lanes 1) or the distal area (lanes 2). Genomic DNA input shows that primers amplify bands of the expected size. Immunoprecipitation of sheared chromatin (ChIP) with anti-Egr-1 (α-Egr-1) produces a band of stronger intensity as compared with the distal site product and to control isotype IgG. C: Immunoprecipitated DNA from the analysis in B was amplified and quantified by real-time PCR using primers surrounding the Egr-1 binding site or the distal area. Fold differences in the amounts of PCR products obtained with anti-Egr-1 antibody relative to isotype controls were calculated as described in Materials and Methods. Average values with SEM from five independent experiments are depicted. There is ∼6- to 10-fold higher amplification of the Egr-1 site fragment compared with the control fragment from the distal area.
Figure 7
Figure 7
Phosphacan accumulation is impaired in the glial scar of Egr-1-deficient mice. A and B: Measurement of GFAP (A) and phosphacan (B) RNA expression levels 10 days after permanent occlusion of the MCA. RNA samples were isolated from wild-type (+/+) and Egr-1-deficient (−/−) mice and from the infarcted, left brain (L) and contralateral, right brain (R) hemispheres. Results were normalized to β-actin RNA expression levels setting arbitrarily the value of one wild-type sample from the right hemisphere as 100. Statistical analysis was performed with the Mann-Whitney rank sum test. Wild-type and Egr-1-deficient mice show comparable GFAP induction. Egr-1−/− mice show a statistically significant reduction of phosphacan levels in the infarcted hemisphere compared with the contralateral site (P = 0.001). The expression levels of phosphacan are also statistically significant different between the infarcted hemispheres of Egr-1−/− mice and their wild-type littermates (P ≤ 0.001). In contrast, there is no statistically significant change of phosphacan expression between both hemispheres (P = 0.163) in wild-type mice and between noninfarcted hemispheres of WT and KO mice (P = 0.380). C: Western blot analysis of brain tissue isolated from the glial scar 10 days after occlusion of the MCA and control (c) tissue from the contralateral brain hemisphere. Quantitative image analysis demonstrates that GFAP up-regulation after stroke is comparable in Egr-1−/− and wild-type brain tissue, ie, 4.4 times in wild-type samples (SD, 0.6) and 4.7 times in Egr-1−/− mice (SD, 1.8). The levels of the two phosphacan isoforms detected by the KAF13 antibody, namely the secreted form of phosphacan (Pcan) as well as the transmembrane isoform receptor protein tyrosine phosphatase β (RPTPβs) are up-regulated in the glial scar of wild types by 1.49-fold (SD, 0.14), but not in the glial scar of Egr-1-deficient animals (0.89-fold; SD, 0.26). β-Tubulin serves as loading control. Protein sizes are indicated in kDa.
Figure 8
Figure 8
Neurite outgrowth and scar size after MCAO appear normal in Egr-1-deficient mice. Analysis of neurite outgrowth and scar size area 10 days after MCAO in Egr-1-deficient (Egr-1−/−) and wild-type (+/+) mice. A–F: Confocal microscopy images of serial sections from infarcted brain tissue that were stained with antibody against the glial marker GFAP to define the infarction border area and the glial scar (A, B), as well as with anti-neurofilament antibody to mark neurites (C, D). Superimposed images are shown in E and F (GFAP in green, neurofilament protein in red). G and H: Quantitative analysis of the staining intensity of the 160-kDa neurofilament marker inside the infarcted tissue to measure neurite outgrowth (G) and GFAP staining to assess scar size area (H). In both cases, there are no statistically significant differences between Egr-1-deficient mice and wild-type littermates (Mann-Whitney rank sum test, P ≥ 0.05).

References

    1. Anderson MF, Blomstrand F, Blomstrand C, Eriksson PS, Nilsson M. Astrocytes and stroke: networking for survival? Neurochem Res. 2003;28:293–305. - PubMed
    1. McKeon RJ, Schreiber RC, Rudge JS, Silver J. Reduction of neurite outgrowth in a model of glial scarring following CNS injury is correlated with the expression of inhibitory molecules on reactive astrocytes. J Neurosci. 1991;11:3398–3411. - PMC - PubMed
    1. Fawcett JW, Asher RA. The glial scar and central nervous system repair. Brain Res Bull. 1999;49:377–391. - PubMed
    1. Silver J, Miller JH. Regeneration beyond the glial scar. Nat Rev Neurosci. 2004;5:146–156. - PubMed
    1. McKeon RJ, Jurynec MJ, Buck CR. The chondroitin sulfate proteoglycans neurocan and phosphacan are expressed by reactive astrocytes in the chronic CNS glial scar. J Neurosci. 1999;19:10778–10788. - PMC - PubMed

Publication types

MeSH terms

Substances