. 2008 Jul 9;130(27):8633-41.
doi: 10.1021/ja8015022. Epub 2008 Jun 17.

Highly efficient circulating tumor cell isolation from whole blood and label-free enumeration using polymer-based microfluidics with an integrated conductivity sensor

Affiliations

Highly efficient circulating tumor cell isolation from whole blood and label-free enumeration using polymer-based microfluidics with an integrated conductivity sensor

André A Adams et al. J Am Chem Soc. .

Abstract

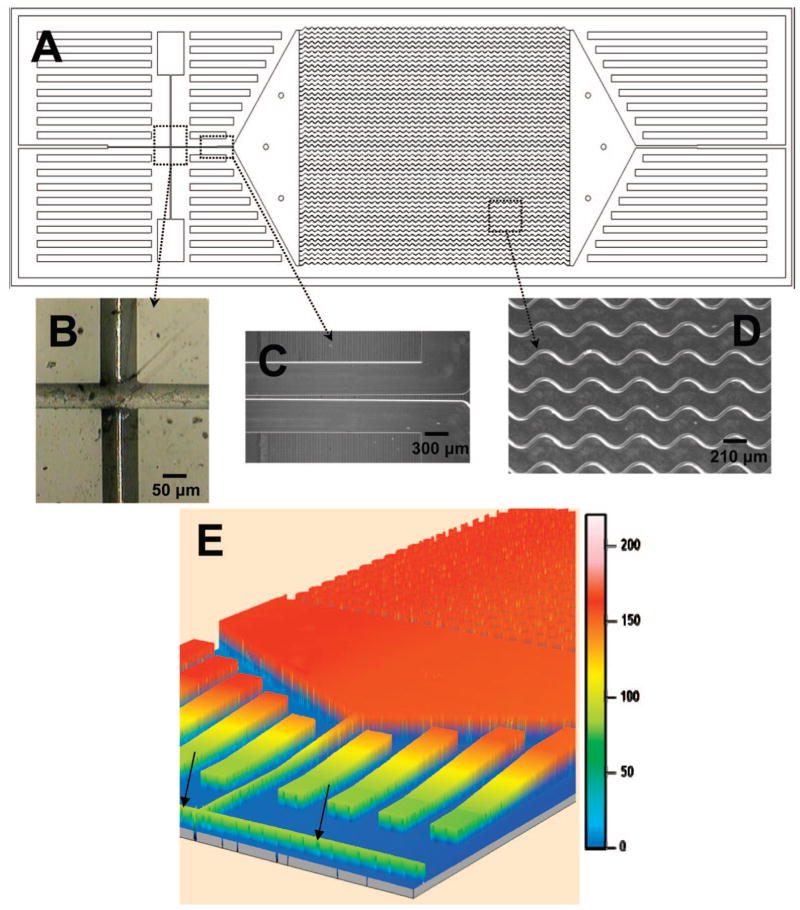
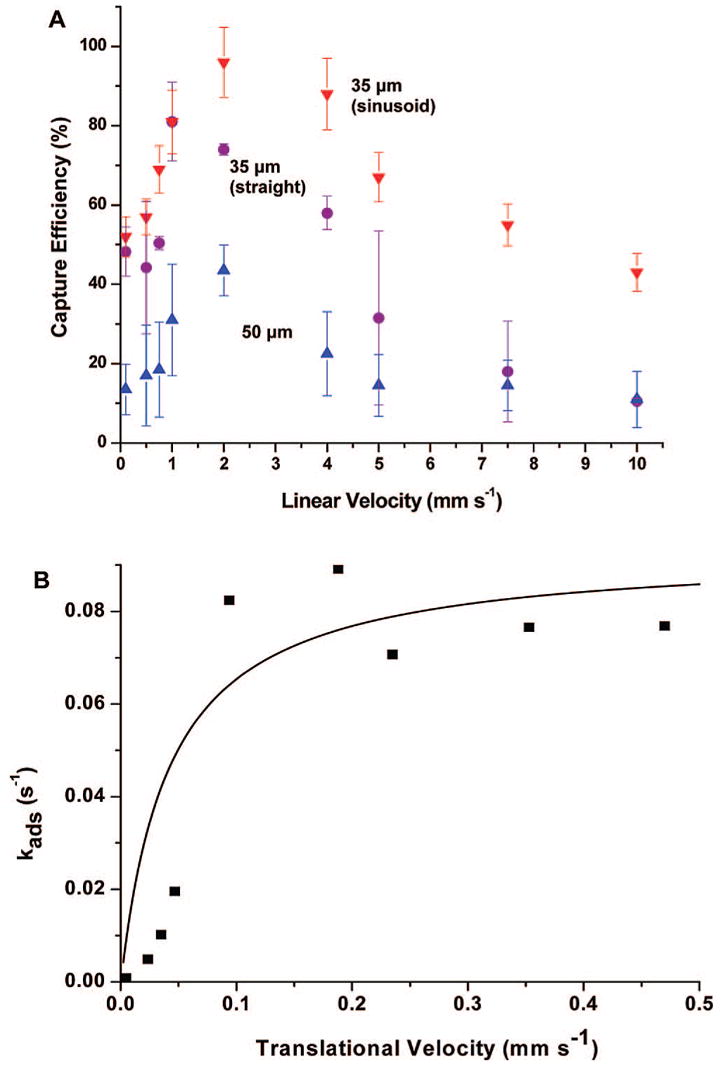
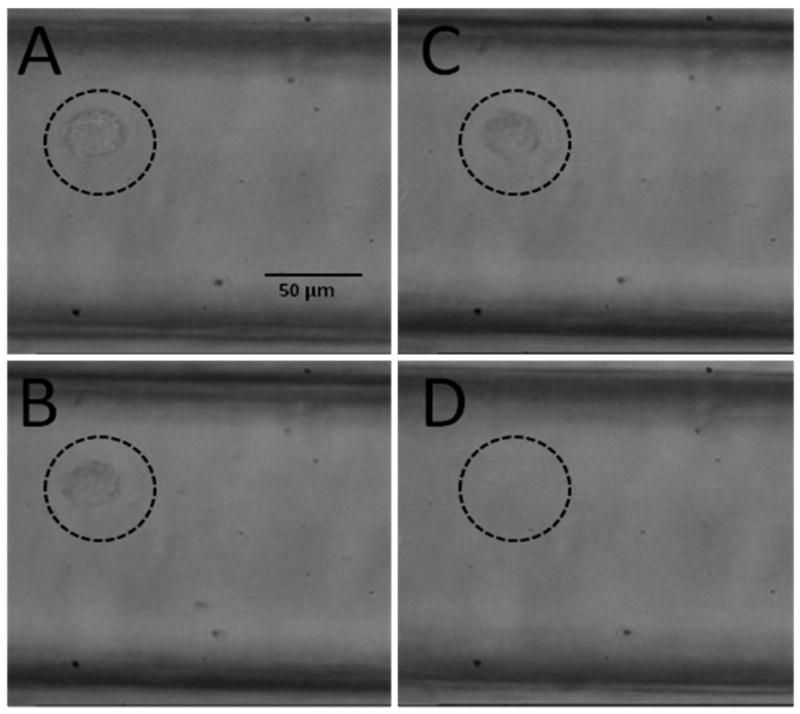
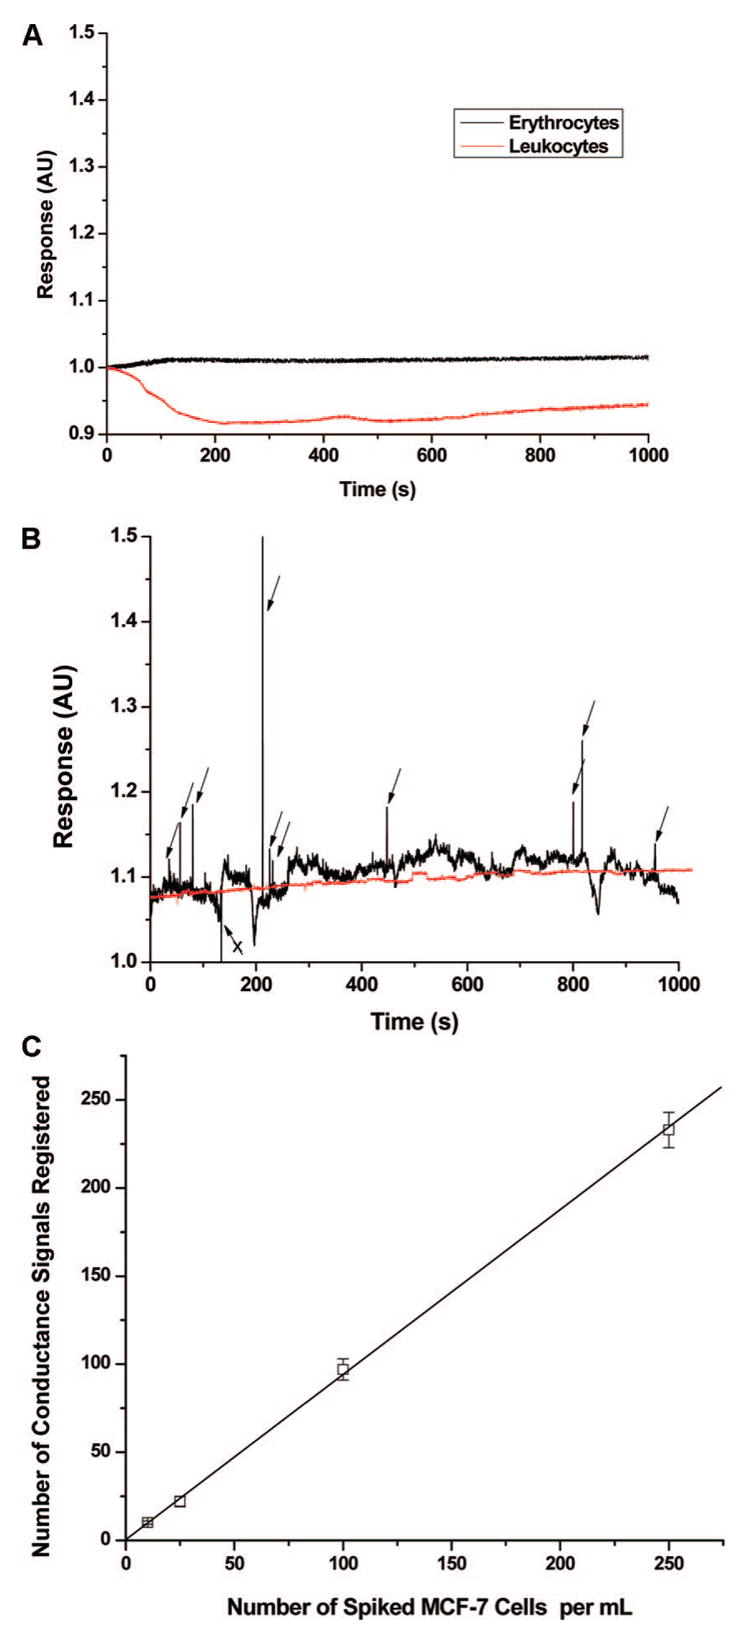
A novel microfluidic device that can selectively and specifically isolate exceedingly small numbers of circulating tumor cells (CTCs) through a monoclonal antibody (mAB) mediated process by sampling large input volumes (>/=1 mL) of whole blood directly in short time periods (<37 min) was demonstrated. The CTCs were concentrated into small volumes (190 nL), and the number of cells captured was read without labeling using an integrated conductivity sensor following release from the capture surface. The microfluidic device contained a series (51) of high-aspect ratio microchannels (35 mum width x 150 mum depth) that were replicated in poly(methyl methacrylate), PMMA, from a metal mold master. The microchannel walls were covalently decorated with mABs directed against breast cancer cells overexpressing the epithelial cell adhesion molecule (EpCAM). This microfluidic device could accept inputs of whole blood, and its CTC capture efficiency was made highly quantitative (>97%) by designing capture channels with the appropriate widths and heights. The isolated CTCs were readily released from the mAB capturing surface using trypsin. The released CTCs were then enumerated on-device using a novel, label-free solution conductivity route capable of detecting single tumor cells traveling through the detection electrodes. The conductivity readout provided near 100% detection efficiency and exquisite specificity for CTCs due to scaling factors and the nonoptimal electrical properties of potential interferences (erythrocytes or leukocytes). The simplicity in manufacturing the device and its ease of operation make it attractive for clinical applications requiring one-time use operation.


Figures

Figure 1
Figure 1
Schematics of the HTMSU showing the following: (A) A scaled AutoCAD diagram of the sinusoidally shaped capture channels with brightfield optical micrographs of (B) the integrated conductivity sensor consisting of cylindrical Pt electrodes that were 75 μm in diameter with a 50 μm gap and (C) the single port exit where the HTMSU tapers from 100 μm wide to 50 μm while the depth tapers from 150 to 80 μm over a 2.5 mm region that ends 2.5 mm from the Pt electrodes; (D) micrograph taken at 5× magnification showing the sinusoidal cell capture channels; and (E) 3D projection of the topology of the HTMSU obtained at 2.5 μm resolution using noncontact optical profilometry (arrows indicate the Pt electrode conduits).
Figure 2
Figure 2
Histograms of the radial position of CTCs (centroid) in microchannels with Poiseulle flow at linear velocities (U) of 1.0 and 10 mm s−1 in both straight (A, B) and sinusoidal-configured (C, D) channels. The dashed line represents the microchannel’s central axis. (A and B) The radial position of several CTCs histogrammed from micrographs of the straight microchannel with linear flow rates of 1 and 10 mm s−1. (C and D) The radial position of several CTCs traversing 1/4 of a period of the sinusoidal microchannels with suspension linear velocities of 1 and 10 mm s−1 are shown. The cells were imaged using fluorescence microscopy with the cells stained using a fluorescein lipophilic membrane dye, PKH67.
Figure 3
Figure 3
Data showing the capture efficiency of CTCs in spiked whole blood samples as a function of the cells’ translational velocity using 35 (red down triangles, sinusoid; purple circles, straight) and 50 μm (blue up triangles) wide microchannels. (A) The microfluidic device consisted of a single channel with the appropriate width and a depth of 150 μm. Following processing of the input buffer containing the MCF-7 cells, the number of captured cells was determined via brightfield microscopy by interrogating the entire length of the capturing channel. (B) The capture efficiency data as a function of the CTC translational velocity were replotted using eq S16 (see Supporting Information) with this data fit to Kf × Cx × Nr using the fitting parameter, kin (EpCAM/anti-EpCAM forward rate constant).
Figure 4
Figure 4
Time lapse micrographs of a captured MCF-7 cell: (A) Prior to exposure to the CTC releasing buffer and (B) exposed to the CTC releasing buffer for ~10 min. (C) The cell appears to be released from the PMMA surface, and finally, (D) the cell is swept away when the flow is initiated.
Figure 5
Figure 5
Conductance responses (in arbitrary units, AU) and calibration plots for CTCs are shown. (A) Conductometric response for suspensions of leukocytes and erythrocytes (cell density = 150 cells/μL) in TRIS-Glycine buffer transported through the integrated conductivity sensor at a volume flow rate of 0.05 μL/min. (B) Conductometric response of a 1.0 mL aliquot of whole blood spiked with 10 ± 1 CTCs or 0 CTCs and processed in the HTMSU at 2.0 mm/s. The isolated CTCs were released from the PMMA surface using the CTC releasing buffer and transported through the conductivity sensor at a volumetric flow rate of 0.05 μL/min. Peak identification was based on a signal-to-noise threshold of 3:1, which was determined by the peak height of the apparent response and the average peak-to-peak variation in the conductance of the CTC releasing buffer. The arrows designate those peaks scored as CTCs based on the aforementioned criteria. The arrow marked with an “X” possessed a conductivity response lower than the background buffer and as such was not scored as a CTC. Of the 10 ± 1 cells seeded into whole blood for this sample, 8 cells were scored above the 3σ threshold level. Also shown in this plot is a sample of whole blood containing no MCF-7 cells that was processed with the HTMSU device (red line). (C) Calibration plot for the number of CTCs seeded (10–250 cells mL−1) into whole blood versus the conductance responses registered using the conductivity sensor following the processing steps delineated in Figure 5B (m = 0.945, r2 = 0.9988), which shows the false positive rate. The data presented in Figure 5B were subjected to a three-point Savitsky–Golay smoothing.

Similar articles

Cited by

References

    1. Leaf C. Fortune. 2004:76–94. - PubMed
    1. Paget S. Lancet. 1889;1:571.
    1. Fidler IJ, Yano S, Zhang RD, Fujimaki T, Bucana CD. Lancet Oncol. 2002;3:53–57. - PubMed
    1. Loberg RD, Fridman Y, Pienta BA, Keller ET, McCauley LK, Taichman RS, Pienta KJ. Neoplasia. 2004;6:302–309. - PMC - PubMed
    1. Braun S, Marth C. New Engl J Med. 2004;351:824–6. - PubMed

Publication types

MeSH terms

Substances