. 2008 Jul;69(2):520-33.
doi: 10.1111/j.1365-2958.2008.06305.x.

Chemical and genetic validation of dihydrofolate reductase-thymidylate synthase as a drug target in African trypanosomes

Affiliations

Chemical and genetic validation of dihydrofolate reductase-thymidylate synthase as a drug target in African trypanosomes

Natasha Sienkiewicz et al. Mol Microbiol. 2008 Jul.

Abstract

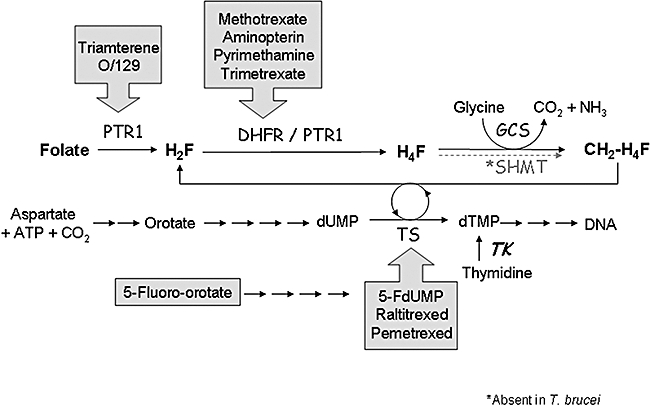
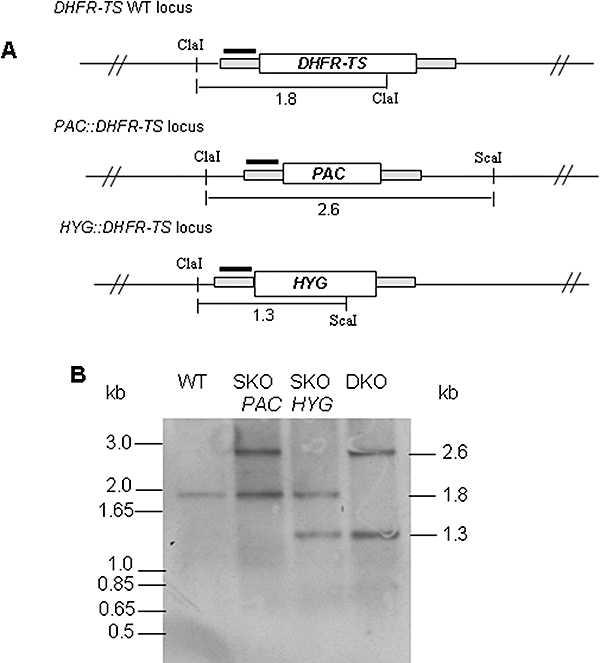
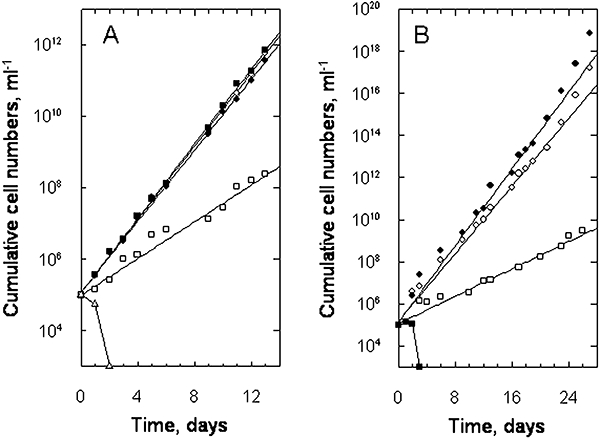
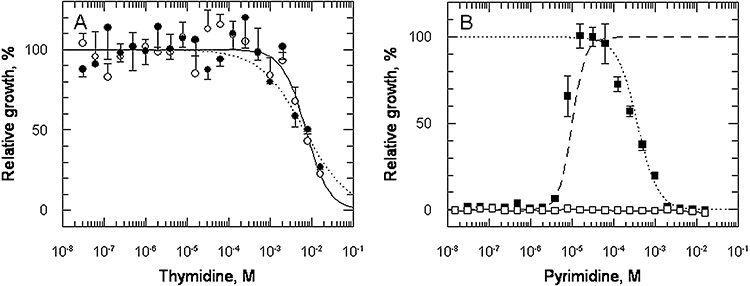
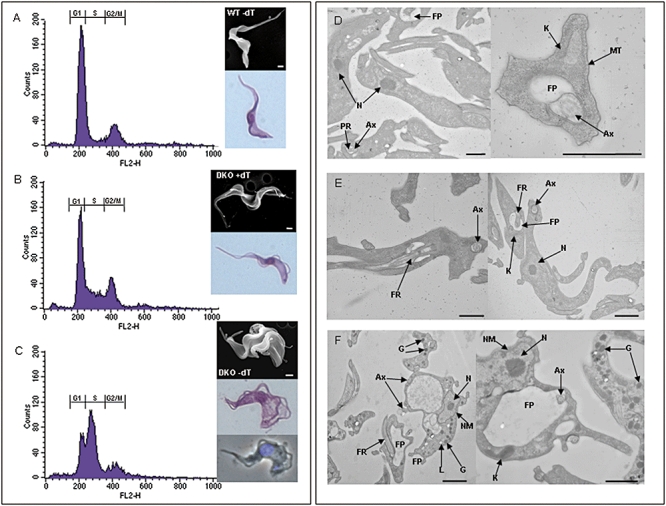
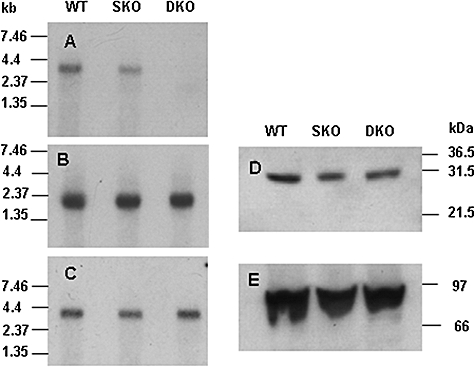
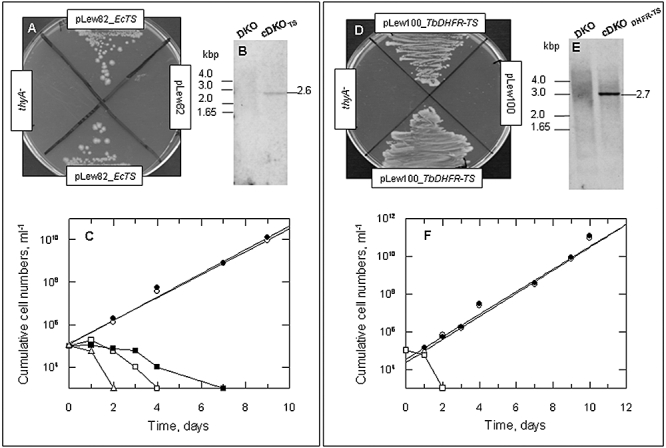
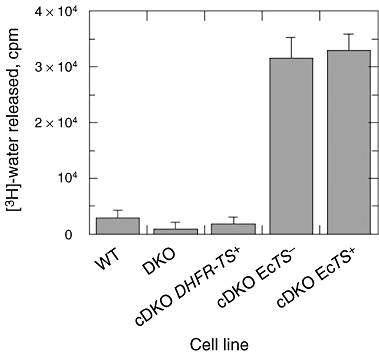
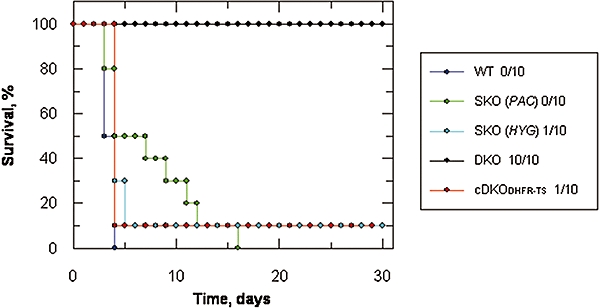
The phenotypes of single- (SKO) and double-knockout (DKO) lines of dihydrofolate reductase-thymidylate synthase (DHFR-TS) of bloodstream Trypanosoma brucei were evaluated in vitro and in vivo. Growth of SKO in vitro is identical to wild-type (WT) cells, whereas DKO has an absolute requirement for thymidine. Removal of thymidine from the medium triggers growth arrest in S phase, associated with gross morphological changes, followed by cell death after 60 h. DKO is unable to infect mice, whereas the virulence of SKO is similar to WT. Normal growth and virulence could be restored by transfection of DKO with T. brucei DHFR-TS, but not with Escherichia coli TS. As pteridine reductase (PTR1) levels are unchanged in SKO and DKO cells, PTR1 is not able to compensate for loss of DHFR activity. Drugs such as raltitrexed or methotrexate with structural similarity to folic acid are up to 300-fold more potent inhibitors of WT cultured in a novel low-folate medium, unlike hydrophobic antifols such as trimetrexate or pyrimethamine. DKO trypanosomes show reduced sensitivity to these inhibitors ranging from twofold for trimetrexate to >10 000-fold for raltitrexed. These data demonstrate that DHFR-TS is essential for parasite survival and represents a promising target for drug discovery.


Figures

Fig. 1
Fig. 1
Pathway of thymidylate synthesis and primary site of action of inhibitors. SHMT, serine hydroxymethyltransferase; DHFR, dihydrofolate reductase; TS, thymidylate synthase; O/129, 2,4-diamino-6,7-diispropylpteridine; PTR1, pteridine reductase 1; TK, thymidine kinase; H2F, dihydrofolate; H4F, tetrahydrofolate; CH2-CH4F, 5, 10-methylene-tetrahydrofolate; FdUMP, 5-fluorodeoxyuridylate; GCS, glycine cleavage system.
Fig. 2
Fig. 2
Genotypic analysis of WT, SKO and DKO cells. A. Structure of the DHFR–TS locus and predicted replacements. The black bars represent the 5′-UTR region upstream of the open reading frames of DHFR–TS, PAC and HYG used as a probe in Southern blot analysis. Only relevant restriction enzyme sites with expected fragment sizes are shown. B. Southern analysis of DNA digested with ClaI and ScaI from WT, SKO (containing PAC and HYG respectively) and DKO cells. DNA size markers are on the left-hand side of blots and the estimated size of detected fragments on the right.
Fig. 3
Fig. 3
Growth characteristics of the T. brucei WT, SKO and DKO cells under various conditions. A. Growth in HMI9 medium in the presence/absence of drug selection. WT, open circles; SKO plus puromycin, closed circles; DKO plus puromycin and hygromycin, open squares; and DKO without drugs, closed squares. Open triangles show the growth of DKO without drugs in HMI9 medium lacking the thymidine component. B. Growth in folate-deficient media (FDM) containing 160 μM thymidine. WT, open circles; SKO plus puromycin, closed circles; DKO plus puromycin and hygromycin, open squares; and DKO without thymidine, closed squares. Data are the means of triplicate cultures, where the standard deviations are 5% or less of the value. Symbols on the x-axis indicate that cell densities are below the limits of detection (i.e. < 103 ml−1). The lines represent the best fits to the equation describing exponential growth as described in Experimental procedures.
Fig. 4
Fig. 4
Effect of pyrimidines on growth. Cells were grown in HMI9 medium supplemented with varying amounts of pyrimidines for 72 h and cell density was determined using Alamar Blue as described in Experimental procedures. A. WT plus thymidine, open circles; SKO plus thymidine, closed circles. B. DKO plus thymidine, closed squares; DKO plus thymine, open squares (a complete lack of growth stimulation was also observed with uracil or uridine). The dashed line is the best fit for growth stimulation and the dotted line is the best fit for growth inhibition.
Fig. 5
Fig. 5
Phenotypic analysis WT and DKO cells grown in the presence or absence of thymidine. Cells were grown in either the absence or presence of thymidine (dT) for 24 h and prepared for FACS, SEM, Giemsa, DAPI and TEM analysis. The histograms from the FACS analysis are presented in (A) WT minus thymidine, (B) DKO plus thymidine, (C) DKO minus thymidine with SEM, Giemsa and DAPI images of the respective cells in the right-hand panels. TEM showing the morphology of the WT (D), DKO plus thymidine (E) and DKO minus thymidine (F) are depicted. Bars represent 1 μm. N, nucleus; NM, nuclear membrane; FR, flagella rod; FP, flagella pocket; Ax, axonemes; G, glycosome; L, lysosome; PR, paraxial rod; MT, microtubules.
Fig. 6
Fig. 6
Northern and Western blot analysis of WT, SKO and DKO cells. Trypanosomes were grown for 24 h in HMI9 medium in the absence (WT and SKO) or presence of thymidine (DKO). A–C. RNA blots probed with TbDHFR–TS, TbPTR1 and TbINO1 respectively. RNA size markers are indicated to the left of the panels. D and E. Protein blots of parasite lysates probed with antiserum to PTR1 and BiP respectively. Approximately 20 μg of protein was loaded per lane. Standard size markers are indicated to the right of the panels.
Fig. 7
Fig. 7
Complementation studies with EcTS and TbDHFR–TS. (A)–(C) Complementation with E. coli TS and (D)–(F) complementation with T. brucei DHFR–TS. A. Growth of E. coli thyA- transformed with pLew82_EcTS or empty vector on thymidine-free medium. B. Southern analysis of T. brucei DKO transfected with pLew82_EcTS (cDKOTS). DNA was digested with SacI and SphI and probed with EcTS ORF. The size of the expected fragment is indicated on the right with standard markers on the left. C. Growth of cDKOTS in HMI9 medium with or without thymidine. Circles, plus thymidine; squares, no thymidine present. Open symbols depict growth without tetracycline induction and closed symbols with tetracycline. Triangles, growth of DKO in the absence of thymidine. The lines represent the best fits to the equation describing exponential growth as described in Experimental procedures. D. Growth of E. coli thyA- transformed with pLew100_TbDHFR–TS or empty vector on thymidine-free medium. E. Southern analysis of T. brucei DKO transfected with pLew100_TbDHFR–TS (cDKODHFR–TS). DNA was digested with HindIII and StuI and probed with TbDHFR–TS. The size of the expected fragment is indicated on the right with standard markers on the left. F. Growth of cDKODHFR–TS in HMI9 medium with and without thymidine (open and closed circles respectively). Open squares, growth of DKO in the absence of thymidine. The lines represent the best fits to the equation describing exponential growth as described in Experimental procedures. Symbols on the x-axis indicate that cell densities are below the limits of detection (i.e. < 103 ml−1).
Fig. 8
Fig. 8
TS activity in WT and transgenic T. brucei. TS activity was determined by release of [3H]-water from [3H]-dUMP as described in Experimental procedures. Error bars represent the standard error of triplicate assays. The minus and plus signs refer to growth in HMI9 medium in the absence or presence of tetracycline respectively.
Fig. 9
Fig. 9
Virulence of WT, SKO and DKO T. brucei infections in mice. Each data set represents the combined results of two independent experiments presented as a Kaplan–Meier survival plot. The figures in the legend are the numbers of survivors per infected group. As the cDKODHFR–TS was not responsive to tetracycline induction these data sets have been combined. Symbols: WT, dark blue; SKO (PAC), green; SKO (HYG), light blue; DKO, black; cDKO, red.

References

    1. Ackland SP, Beale P, Peters GJ. Thymidylate synthase inhibitors. Cancer Chemother Biol Response Modif. 2003;21:1–28. - PubMed
    1. Ahmad SI, Kirk SH, Eisenstark A. Thymine metabolism and thymineless death in prokaryotes and eukaryotes. Annu Rev Microbiol. 1998;52:591–625. - PubMed
    1. Ahrweiler PM, Frieden C. Construction of a fol mutant strain of Escherichia coli for use in dihydrofolate reductase mutagenesis experiments. J Bacteriol. 1988;170:3301–3304. - PMC - PubMed
    1. Allen CL, Goulding D, Field MC. Clathrin-mediated endocytosis is essential in Trypanosoma brucei. EMBO J. 2003;22:4991–5002. - PMC - PubMed
    1. Backus HH, Pinedo HM, Wouters D, Padron JM, Molders N, Der Wilt CL, et al. Folate depletion increases sensitivity of solid tumor cell lines to 5-fluorouracil and antifolates. Int J Cancer. 2000;87:771–778. - PubMed

Publication types

MeSH terms