

Gene expression profiling of human epidermal keratinocytes in simulated microgravity and recovery cultures
- PMID: 18558382
- PMCID: PMC5054098
- DOI: 10.1016/S1672-0229(08)60017-0
Gene expression profiling of human epidermal keratinocytes in simulated microgravity and recovery cultures
Abstract
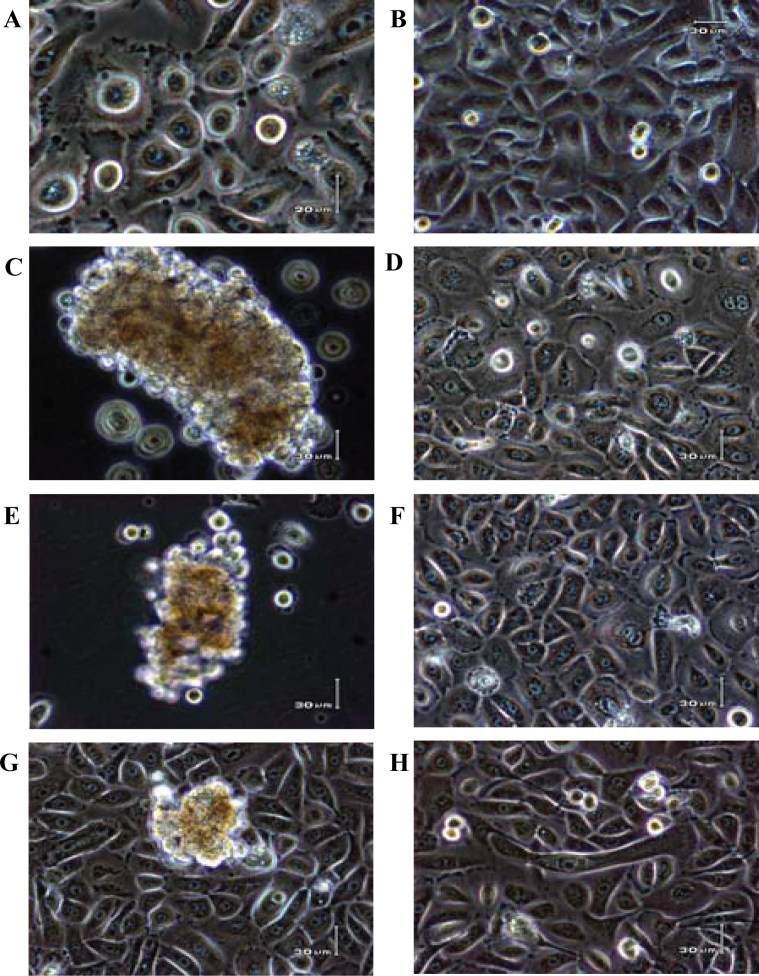
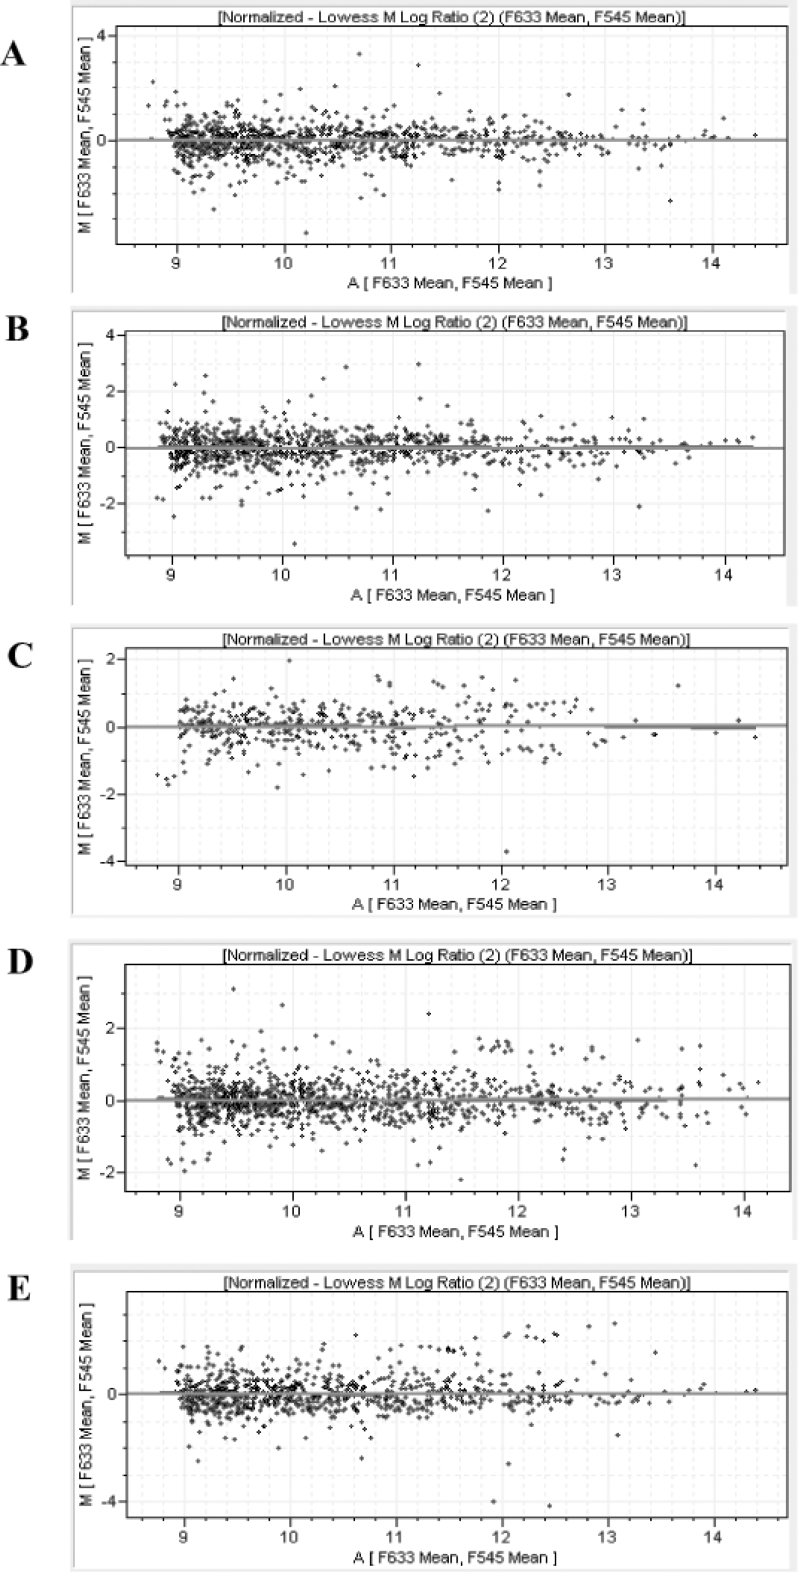
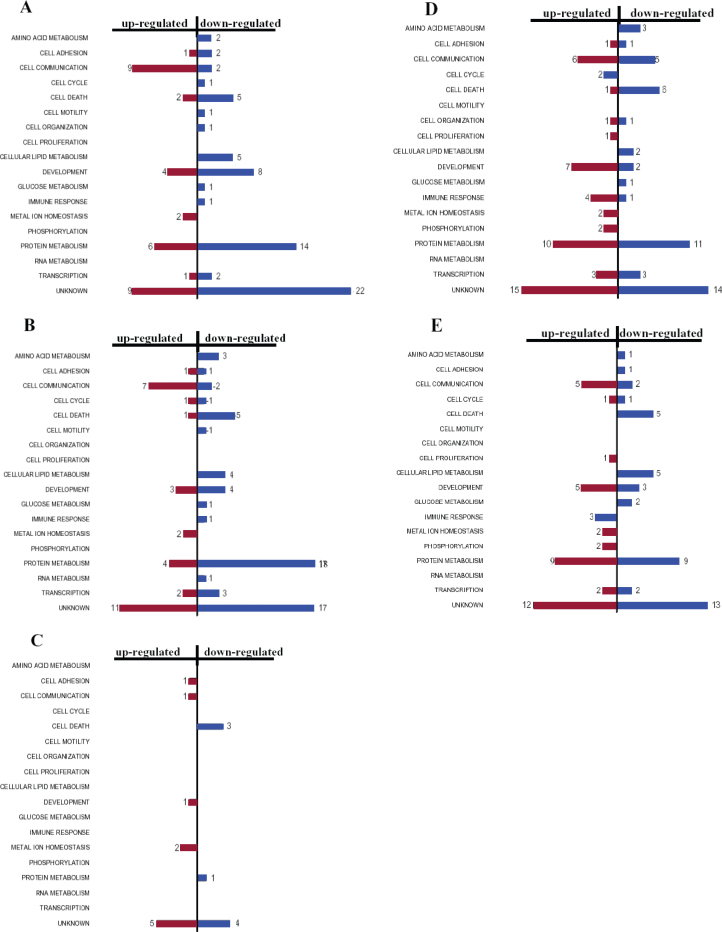
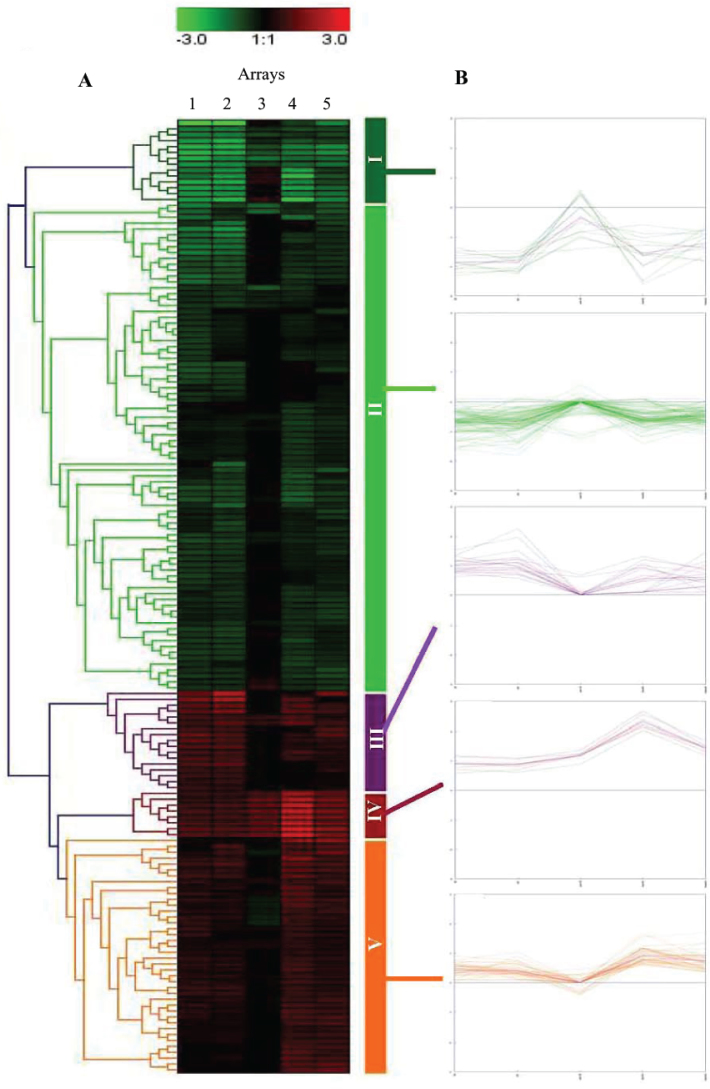
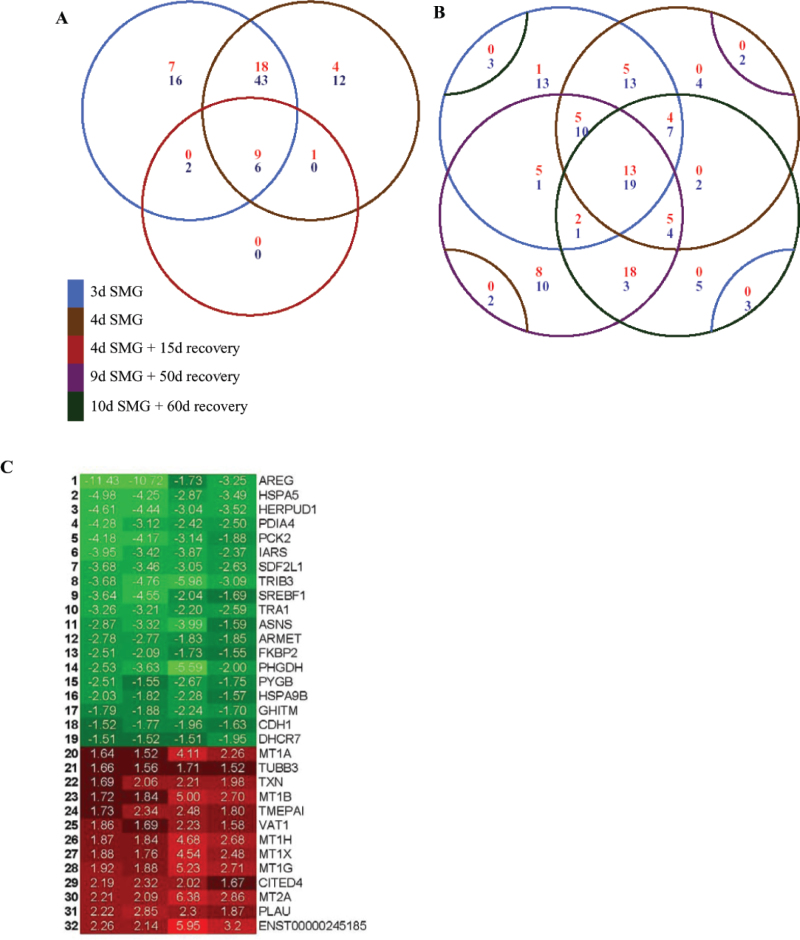
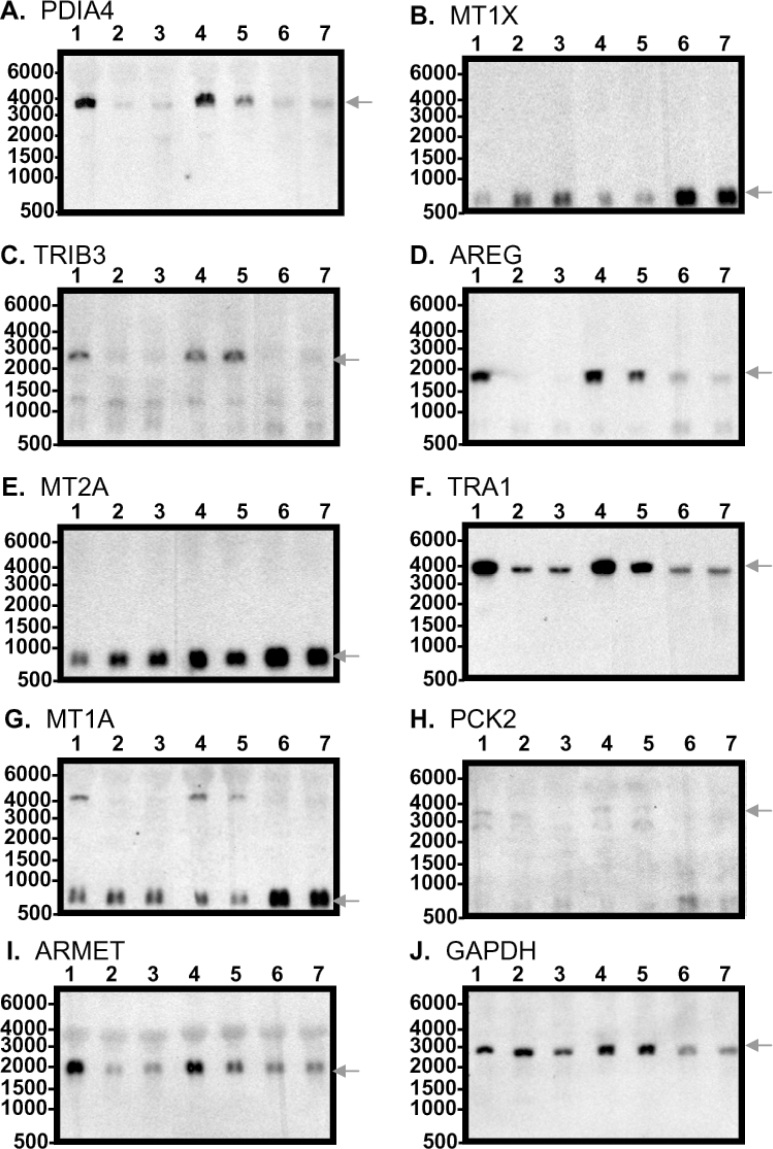
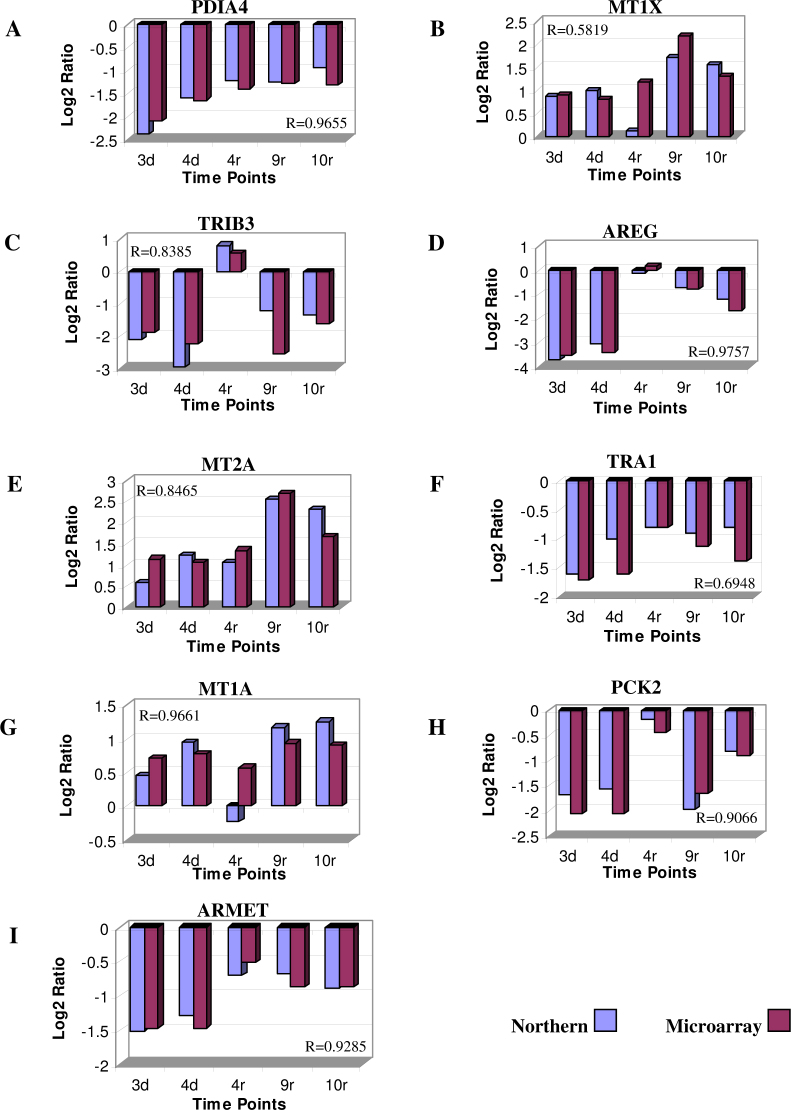
Simulated microgravity (SMG) bioreactors and DNA microarray technology are powerful tools to identify "space genes" that play key roles in cellular response to microgravity. We applied these biotechnology tools to investigate SMG and post-SMG recovery effects on human epidermal keratinocytes by exposing cells to SMG for 3, 4, 9, and 10 d using the high aspect ratio vessel bioreactor followed by recovery culturing for 15, 50, and 60 d in normal gravity. As a result, we identified 162 differentially expressed genes, 32 of which were "center genes" that were most consistently affected in the time course experiments. Eleven of the center genes were from the integrated stress response pathways and were coordinately down-regulated. Another seven of the center genes, which are all metallothionein MT-I and MT-II isoforms, were coordinately up-regulated. In addition, HLA-G, a key gene in cellular immune response suppression, was found to be significantly up-regulated during the recovery phase. Overall, more than 80% of the differentially expressed genes from the shorter exposures (<or=4 d) recovered in 15 d; for longer (>or=9 d) exposures, more than 50 d were needed to recover to the impact level of shorter exposures. The data indicated that shorter SMG exposure duration would lead to quicker and more complete recovery from the microgravity effect.
Figures
Similar articles
-
Genome-wide gene expression profiling of microgravity effect on human liver cells.J Gravit Physiol. 2007 Jul;14(1):P121-2. J Gravit Physiol. 2007. PMID: 18372729
-
Yeast genomic expression patterns in response to low-shear modeled microgravity.BMC Genomics. 2007 Jan 3;8:3. doi: 10.1186/1471-2164-8-3. BMC Genomics. 2007. PMID: 17201921 Free PMC article.
-
Simulated microgravity significantly altered metabolism in epidermal stem cells.In Vitro Cell Dev Biol Anim. 2020 Mar;56(3):200-212. doi: 10.1007/s11626-020-00435-8. Epub 2020 Mar 20. In Vitro Cell Dev Biol Anim. 2020. PMID: 32198676 Free PMC article.
-
Spaceflight bioreactor studies of cells and tissues.Adv Space Biol Med. 2002;8:177-95. doi: 10.1016/s1569-2574(02)08019-x. Adv Space Biol Med. 2002. PMID: 12951697 Review.
-
Effects of gravity on the cellular response to epidermal growth factor.Adv Space Biol Med. 1994;4:159-88. doi: 10.1016/s1569-2574(08)60139-2. Adv Space Biol Med. 1994. PMID: 7757250 Review.
Cited by
-
Changes in mitochondrial homeostasis and redox status in astronauts following long stays in space.Sci Rep. 2016 Dec 16;6:39015. doi: 10.1038/srep39015. Sci Rep. 2016. PMID: 27982062 Free PMC article. Clinical Trial.
-
Omics Studies of Specialized Cells and Stem Cells under Microgravity Conditions.Int J Mol Sci. 2024 Sep 17;25(18):10014. doi: 10.3390/ijms251810014. Int J Mol Sci. 2024. PMID: 39337501 Free PMC article. Review.
-
Simulated microgravity triggers epithelial mesenchymal transition in human keratinocytes.Sci Rep. 2017 Apr 3;7(1):538. doi: 10.1038/s41598-017-00602-0. Sci Rep. 2017. PMID: 28373722 Free PMC article.
-
Microgravity influences circadian clock oscillation in human keratinocytes.FEBS Open Bio. 2015 Aug 31;5:717-23. doi: 10.1016/j.fob.2015.08.012. eCollection 2015. FEBS Open Bio. 2015. PMID: 26448904 Free PMC article.
-
Integration analysis of microRNA and mRNA expression profiles in human peripheral blood lymphocytes cultured in modeled microgravity.Biomed Res Int. 2014;2014:296747. doi: 10.1155/2014/296747. Epub 2014 Jun 23. Biomed Res Int. 2014. PMID: 25045661 Free PMC article.
References
-
- Leach C.S. Medical considerations for extending human presence in space. Acta Astronaut. 1990;21:659–666. - PubMed
-
- Cogoli A. The effect of hypogravity and hypergravity on cells of the immune system. J. Leukoc. Biol. 1993;54:259–268. - PubMed
-
- Cogoli A. Mitogenic signal transduction in T lymphocytes in microgravity. J. Leukoc. Biol. 1993;53:569–575. - PubMed
-
- Fritsch-Yelle J.M. Microgravity decreases heart rate and arterial pressure in humans. J. Appl. Physiol. 1996;80:910–914. - PubMed
Publication types
MeSH terms
Grants and funding
LinkOut - more resources
Full Text Sources
Other Literature Sources
Research Materials
